Vizro-AI advanced usage and options
This guide shows you how to use the chart_agent, including running it, working with the BaseChartPlan response model, and leveraging Pydantic AI agent capabilities.
Required for Jupyter Notebooks
For Vizro-AI to work properly in Jupyter Notebooks, you must add the following two lines at the beginning of your notebook:
This is required because of conflicts between Jupyter's event loop and Pydantic AI's event loop. For more details, see the Pydantic AI troubleshooting guide.
Setup for examples below
The examples in this guide assume you have set up a model and data. For model setup, see the model setup guide. A typical setup looks like:
import plotly.express as px
from pydantic_ai.models.openai import OpenAIChatModel
from pydantic_ai.providers.openai import OpenAIProvider
from vizro_ai.agents import chart_agent
model = OpenAIChatModel(
"gpt-5-nano-2025-08-07",
provider=OpenAIProvider(api_key="your-api-key-here"),
)
df = px.data.gapminder()
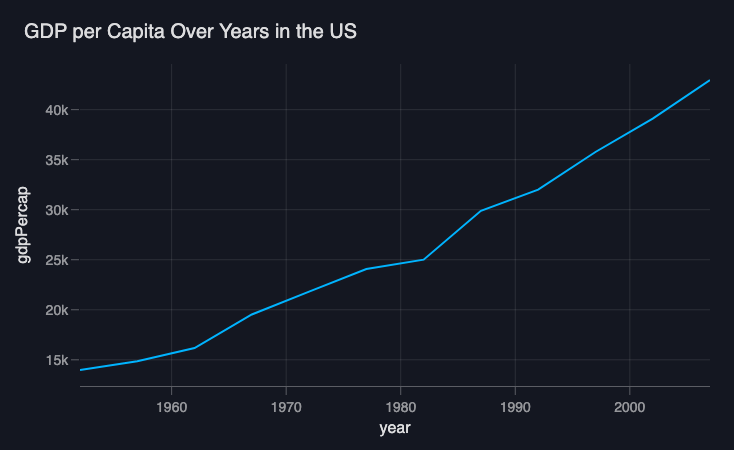
result = chart_agent.run_sync(
model=model,
user_prompt="the trend of gdp over years in the US",
deps=df,
)
In the examples below, we'll focus on the specific properties and methods, assuming you already have a result object from running chart_agent.
chart_agent
The chart_agent is the main interface for generating charts. Use run_sync() to synchronously run the agent and generate a chart based on your natural language prompt. This method is perfect for scripts and notebooks.
run_sync() method
Synchronously runs the chart_agent to generate a chart based on your prompt.
Parameters:
model: The LLM model to use (see model setup guide)user_prompt: Natural language description of the chart you want to createdeps: The pandas DataFrame containing your dataoutput_type: Optional response model type (defaults toBaseChartPlan)
Returns: A result object containing a BaseChartPlan in result.output.
run_sync()
Note that if you run this code, its appearance may not precisely resemble the one displayed, as it is generated by a generative AI and can vary.
BaseChartPlan
When you run chart_agent.run_sync() or chart_agent.run(), the result contains a BaseChartPlan object in result.output. This object contains the generated chart code and metadata.
code_vizro property
Returns the generated chart code formatted for use in Vizro dashboards. The function will include the @capture("graph") decorator and use vizro.plotly.express.
Access the code_vizro property
code property
Returns the generated chart code as a pure Plotly code string. The function will be named custom_chart.
Access the code property
chart_function property
Returns a reusable callable function that generates a pure Plotly chart (vizro=False). This property returns the generated chart function directly, so any **kwargs you pass must be accepted by that function.
Returns: A callable function that accepts data_frame and **kwargs and returns a go.Figure object.
Use chart_function property
# Assuming you have a result object from chart_agent.run_sync()
# For model and data setup, see setup note above.

# Direct usage
fig = result.output.chart_function(df)
fig.show()

# Assign to variable for reuse
chart_func = result.output.chart_function
fig1 = chart_func(df)
fig2 = chart_func(df.head(10))  # Different dataframe

# With kwargs (only if the generated chart function accepts them)
fig = result.output.chart_function(df, title="Custom Title")
[![VizroAIChart]][vizroaichart]
vizro_chart_function property
Returns a reusable callable function that generates a Vizro-compatible chart (vizro=True). This is a convenience property that internally calls get_chart_function(chart_name="custom_chart", vizro=True). Since the generated function is returned directly, any **kwargs you pass must be accepted by that function.
Returns: A callable function that accepts data_frame and **kwargs and returns a go.Figure object.
Use vizro_chart_function property
# Assuming you have a result object from chart_agent.run_sync()
# For model and data setup, see setup note above.

# Direct usage
fig = result.output.vizro_chart_function(df)
fig.show()

# Assign to variable for reuse
vizro_func = result.output.vizro_chart_function
fig = vizro_func(df, title="Vizro Chart")
get_chart_function() method
Returns a reusable callable function with customizable name and vizro flag. This method allows you to specify a custom function name and whether to generate Vizro-compatible code. The returned function can be called later with different dataframes and optional keyword arguments. Since the generated function is returned directly, any **kwargs you pass must be accepted by that function.
Parameters:
chart_name: Name for the chart functionvizro: Whether to generate Vizro-compatible code
Returns: A callable function that accepts data_frame and **kwargs and returns a go.Figure object.
Use get_chart_function method
# Assuming you have a result object from chart_agent.run_sync()
# For model and data setup, see setup note above.

# With custom name
chart_func = result.output.get_chart_function(chart_name="my_chart", vizro=False)
fig = chart_func(df)

# With vizro flag
vizro_func = result.output.get_chart_function(chart_name="custom_chart", vizro=True)
fig = vizro_func(df)

# Combined: custom name and vizro
chart_func = result.output.get_chart_function(chart_name="my_vizro_chart", vizro=True)
fig = chart_func(df, title="Custom Vizro Chart")

# Reuse with different dataframes
fig1 = chart_func(df)
fig2 = chart_func(df.head(20))
[![VizroAIChart]][vizroaichart]
When to use which method
- Use
chart_functionproperty when you want a simple, reusable Plotly chart function without customization - Use
vizro_chart_functionproperty when you want a simple, reusable Vizro-compatible chart function - Use
get_chart_function()method when you need to customize the function name or need more control over the chart generation
Alternative response models
You can also use ChartPlan or a model created by ChartPlanFactory as output types. ChartPlan extends BaseChartPlan with additional explanatory fields like chart_insights and code_explanation. ChartPlanFactory creates a dynamically validated model class that tests code execution before accepting the response.
from vizro_ai.agents import chart_agent
from vizro_ai.agents.response_models import ChartPlan, ChartPlanFactory
# For model and data setup, see setup note above.

result = chart_agent.run_sync(
    model=model,
    user_prompt="create a bar chart",
    deps=df,
    output_type=ChartPlan
)
print(result.output.chart_insights)
Pydantic-AI agent capabilities
Since chart_agent is a Pydantic AI agent, you can leverage all Pydantic AI features:
Async execution
Use chart_agent.run() for async execution instead of run_sync():
import asyncio
# ... model and data setup (see setup note above) ...

async def main():
    result = await chart_agent.run(
        model=model,
        user_prompt="create a bar chart",
        deps=df,
    )
    fig = result.output.chart_function(df)
    fig.show()

if __name__ == "__main__":
    asyncio.run(main())
Streaming
Stream responses as they're generated:
import asyncio
# ... model and data setup (see setup note above) ...

async def main():
    async with chart_agent.run_stream(
        model=model,
        user_prompt="create a bar chart",
        deps=df,
    ) as response:
        async for text in response.stream_output():
            print(text)
        result = await response.get_output()
    fig = result.chart_function(df)
    fig.show()

if __name__ == "__main__":
    asyncio.run(main())
Dependency injection
The deps parameter allows you to inject any dependency (in this case, the DataFrame). This enables flexible data handling and can be extended for more complex use cases. See the Pydantic AI documentation for more details.
Custom instructions and tools
You can extend the chart_agent with custom instructions and tools, just like any Pydantic AI agent. See the Pydantic AI documentation for more details.
Web Chat UI
You can create an interactive web chat interface for chart_agent using Pydantic AI's built-in Web Chat UI. Install the extra:
Create a web chat interface
Run the app with any ASGI server:
For more details, see the Pydantic AI Web Chat UI documentation.
Agent2Agent (A2A) protocol
The chart_agent can participate in agent-to-agent workflows using the A2A protocol. You will need to install pip install "pydantic-ai-slim[a2a]" to use this feature.
Use chart_agent in an A2A workflow
For more details, see the Pydantic AI A2A protocol documentation.
Learn more
For more information on Pydantic AI agent capabilities, see the Pydantic AI agents documentation.