Retrieve the code of Vizro-AI generated dashboard
Feature in Alpha Version
This feature is currently in Alpha version. It is stable but not officially released yet. We welcome feedback via the GitHub Issues. Note that the feature and its API may still undergo minor adjustments.
This guide shows how to retrieve the code of a Vizro-AI generated dashboard. The code can be used for further iterations, improvements and deployment.
While Vizro-AI can follow complex user requirements well and generate high-quality dashboards, due to the nature of LLMs, the generated dashboards often only approximately match user expectations. Besides refining the user prompt and re-running Vizro-AI, you can also extract the code and iterate manually to achieve the desired result.
1. Prepare the data and user prompt
import vizro.plotly.express as px

df = px.data.tips()

user_question = """
Create a one-page dashboard layout with the following components:

1. Card:
   - Position: Left of the page
   - Size: Takes up 1/4 of the total page width
   - Content: Display the text "This is Tips dataset"

2. Table:
   - Position: Right of the card
   - Size: Takes up the remaining 3/4 of the page width
   - Content: Display the Tips dataset
"""
2. Generate and launch the dashboard
This will trigger the dashboard building process. Once Vizro-AI finishes the dashboard generation process, you can now launch the dashboard.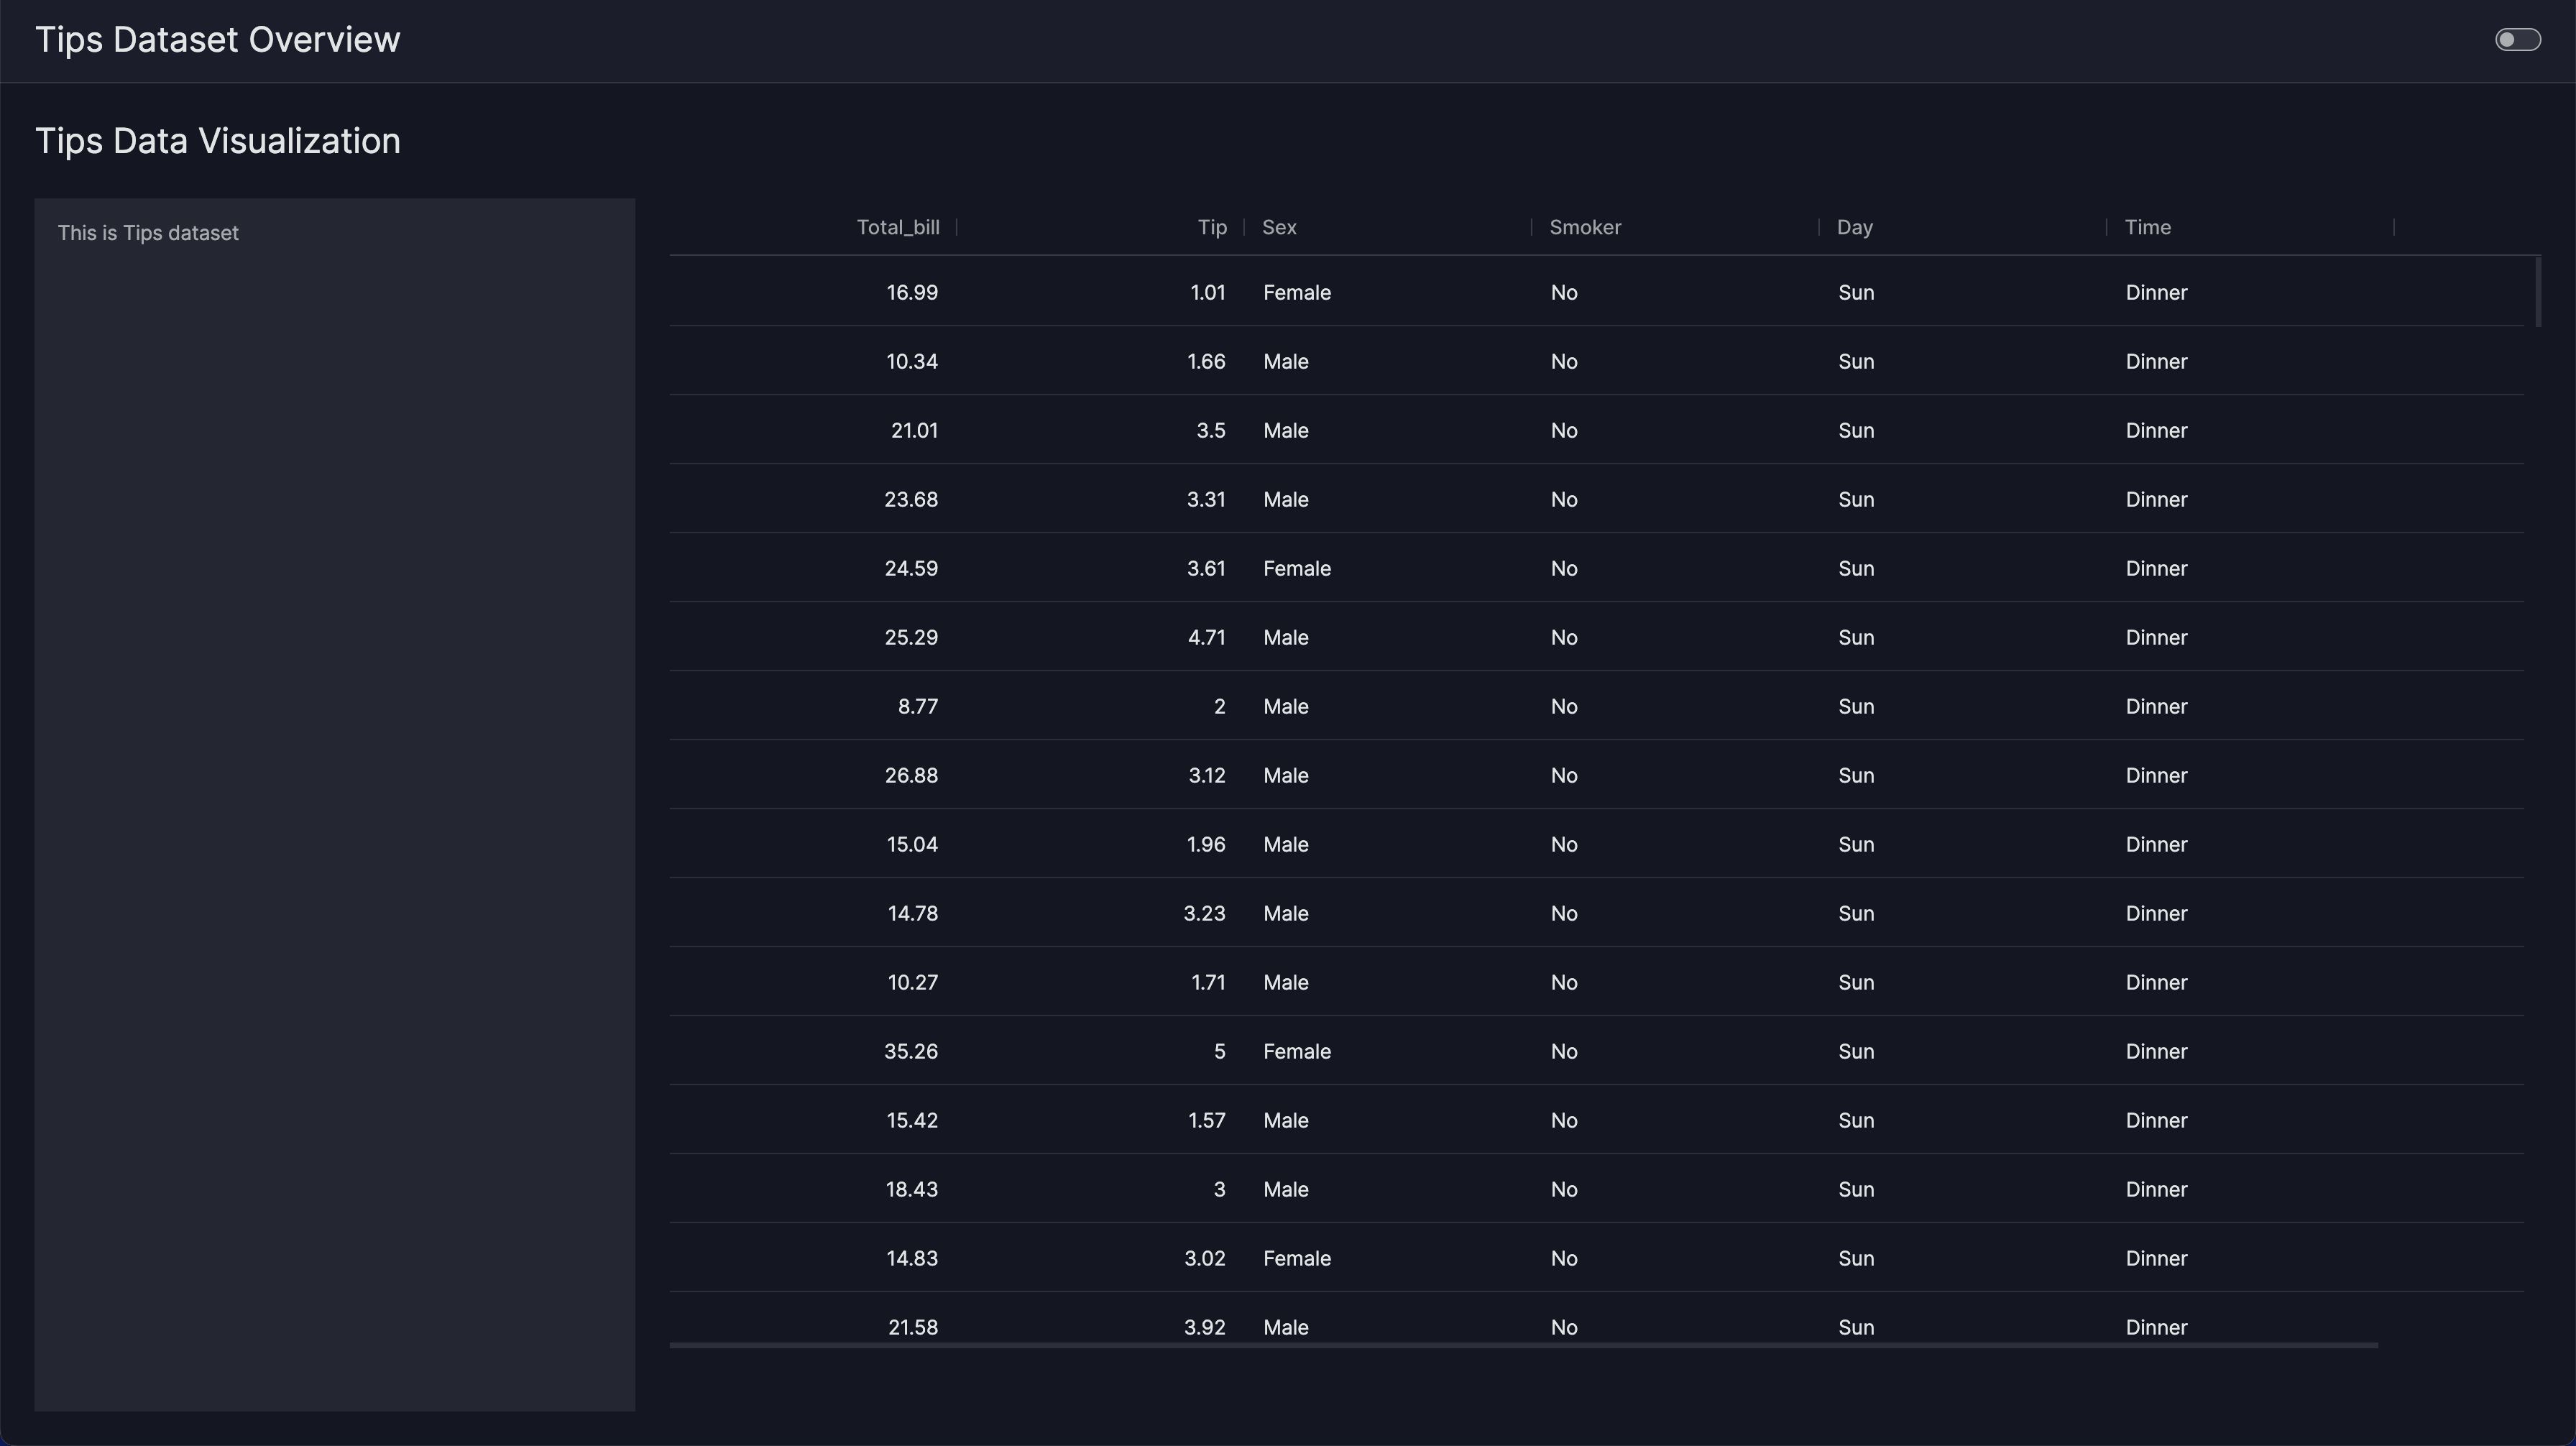
3. Retrieve the Python code of the dashboard
View dashboard code
######## Module Imports ##########
from vizro import Vizro
from vizro.managers import data_manager
from vizro.models.types import capture
import vizro.models as vm
from vizro.tables import dash_ag_grid

########## Data Imports ##########
#####!!! UNCOMMENT BELOW !!!######
# data_manager["restaurant_bills"] = ===> Fill in here <===

###### Callable definitions ######


########## Object code ###########
dashboard = vm.Dashboard(
    pages=[
        vm.Page(
            id="Tips Data Visualization",
            components=[
                vm.Card(
                    id="tips_card_tips_data_visualization",
                    type="card",
                    text="This is Tips dataset",
                    href="",
                ),
                vm.AgGrid(
                    id="tips_table_tips_data_visualization",
                    figure=dash_ag_grid(data_frame="restaurant_bills"),
                ),
            ],
            title="Tips Data Visualization",
            layout=vm.Layout(grid=[[0, 1, 1, 1]]),
            controls=[],
        )
    ],
    title="Tips Dataset Overview",
)