How to run Vizro-AI
This guide offers insights into different ways of running Vizro-AI code to generate Plotly charts. We cover how to use:
Jupyter Notebook
To run Vizro-AI code in a Jupyter Notebook, create a new cell and execute the code below to render the described visualization as output.
Note: API key
Make sure you have followed the LLM setup guide and thatyour api key is set up in a .env file in the same folder as your Notebook file (.ipynb).
Ask Vizro-AI to generate a bar chart

Note that if you run this code, its appearance may not precisely resemble the one displayed, as it is generated by a generative AI and can vary.
Python script
You can use Vizro-AI in any standard development environment by creating a .py file and executing the code, which displays the output in a browser window.
Note: API key
Make sure you have followed LLM setup guide and that your API key is set up in the environment where your .py script is running with command as below:
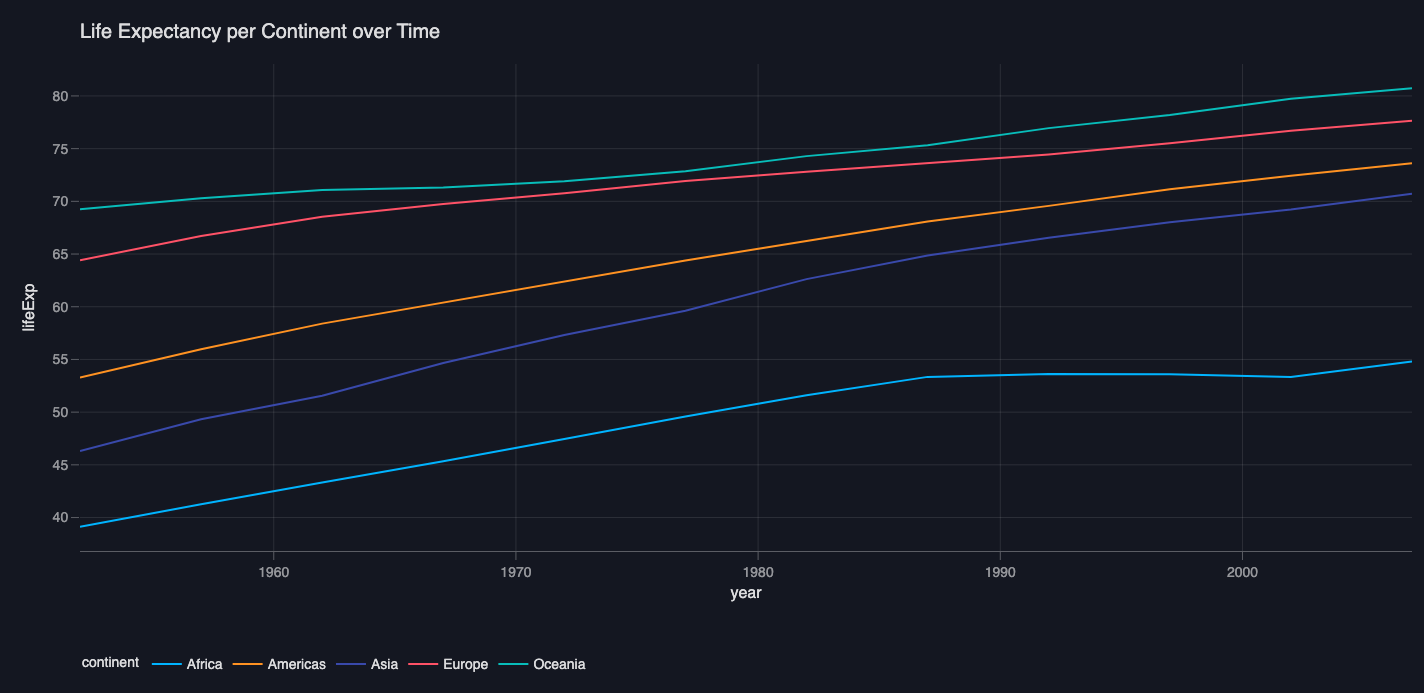
Ask Vizro-AI to generate a line chart
Application integration
You may prefer to integrate Vizro-AI into an application that offers a UI for users to input prompts.
There are two ways to integrate Vizro-AI into an application: directly and by accessing the chart code behind a fig object.
1. Access outputs from PlotOutputs
Vizro-AI's plot method returns a plotly.graph_objects object (fig) that can be used directly within a Vizro dashboard.**
Accessing outputs from PlotOutputs data class
2. Direct application integration
When the return_elements argument of VizroAI's plot method is set to True, the method returns a PlotOutputs data class which contains all possible VizroAI.plot() outputs, so you can access code or the figure object.**
Vizro-AI validates the code to ensure that it is executable and can be integrated.
Direct application integration
The code_string returned can be used to dynamically render charts within your application. You may have the option to encapsulate the chart within a fig object or convert the figure into a JSON string for further integration.
To use the insights or code explanation, you can use vizro_ai._run_plot_tasks(df, ..., explain=True), which returns a dictionary containing the code explanation and chart insights alongside the code.
plot_outputs = vizro_ai.plot(df, "describe life expectancy per continent over time", explain=True, return_elements=True)
fig = plot_outputs.figure
code_string = plot_outputs.code
How to use the max_debug_retry parameter
When calling plot() with a complex request, you may sometimes find that the function returns an error that it has exceeded the number of debug retries. One option is to rephrase the prompt text in your request, but you can also adjust the max_debug_retry parameter to increase the number of retries from the default value of 3.
For example, if you would like adjust to 5 retries, you can set max_debug_retry = 5 in the plot function:
How to use return_elements parameter
By default, when calling plot, the return_elements is set to False, and the function returns a plotly.graph_objects object.
As shown above, if return_elements is set to True, plot() returns the PlotOutputs data class, which is designed to encapsulate all possible outputs generated.
Attributes of PlotOutputs:
code: A string representing of the Python code that manipulates the data and creates the visualization.figure: ACapturedCallableobject fromVizro, representing the visual plot generated byVizroAI.plot(). This object is designed to run immediately in the Vizro dashboard, but otherwise, it behaves like a plotlygo.Figure.business_insights: A string containing high-level business insights derived from the plot.business_insightsis only available ifexplain=True.code_explanation: A string offering a detailed explanation of the code used to produce the plot.code_explanationis only available ifexplain=True.