How to use graphs
This guide shows you how to use graphs to visualize your data in the dashboard.
The Graph model is the most used component in many dashboards, allowing you to visualize data in a variety of ways.
To add a Graph to your page, do the following:
- insert the
Graphmodel into thecomponentsargument of thePagemodel - enter any of the currently available charts of the open source library
plotly.expressinto thefigureargument
Note
In order to use the plotly.express chart in a Vizro dashboard, you need to import it as import vizro.plotly.express as px.
This leaves any of the plotly.express functionality untouched, but allows direct insertion into the Graph model as is.
Note also that the plotly.express chart needs to have a data_frame argument. In case you require a chart without
a data_frame argument (for example, the imshow chart), refer to our
guide on custom charts.
Graph
import vizro.models as vm
import vizro.plotly.express as px
from vizro import Vizro
df = px.data.iris()
page = vm.Page(
title="My first page",
components=[
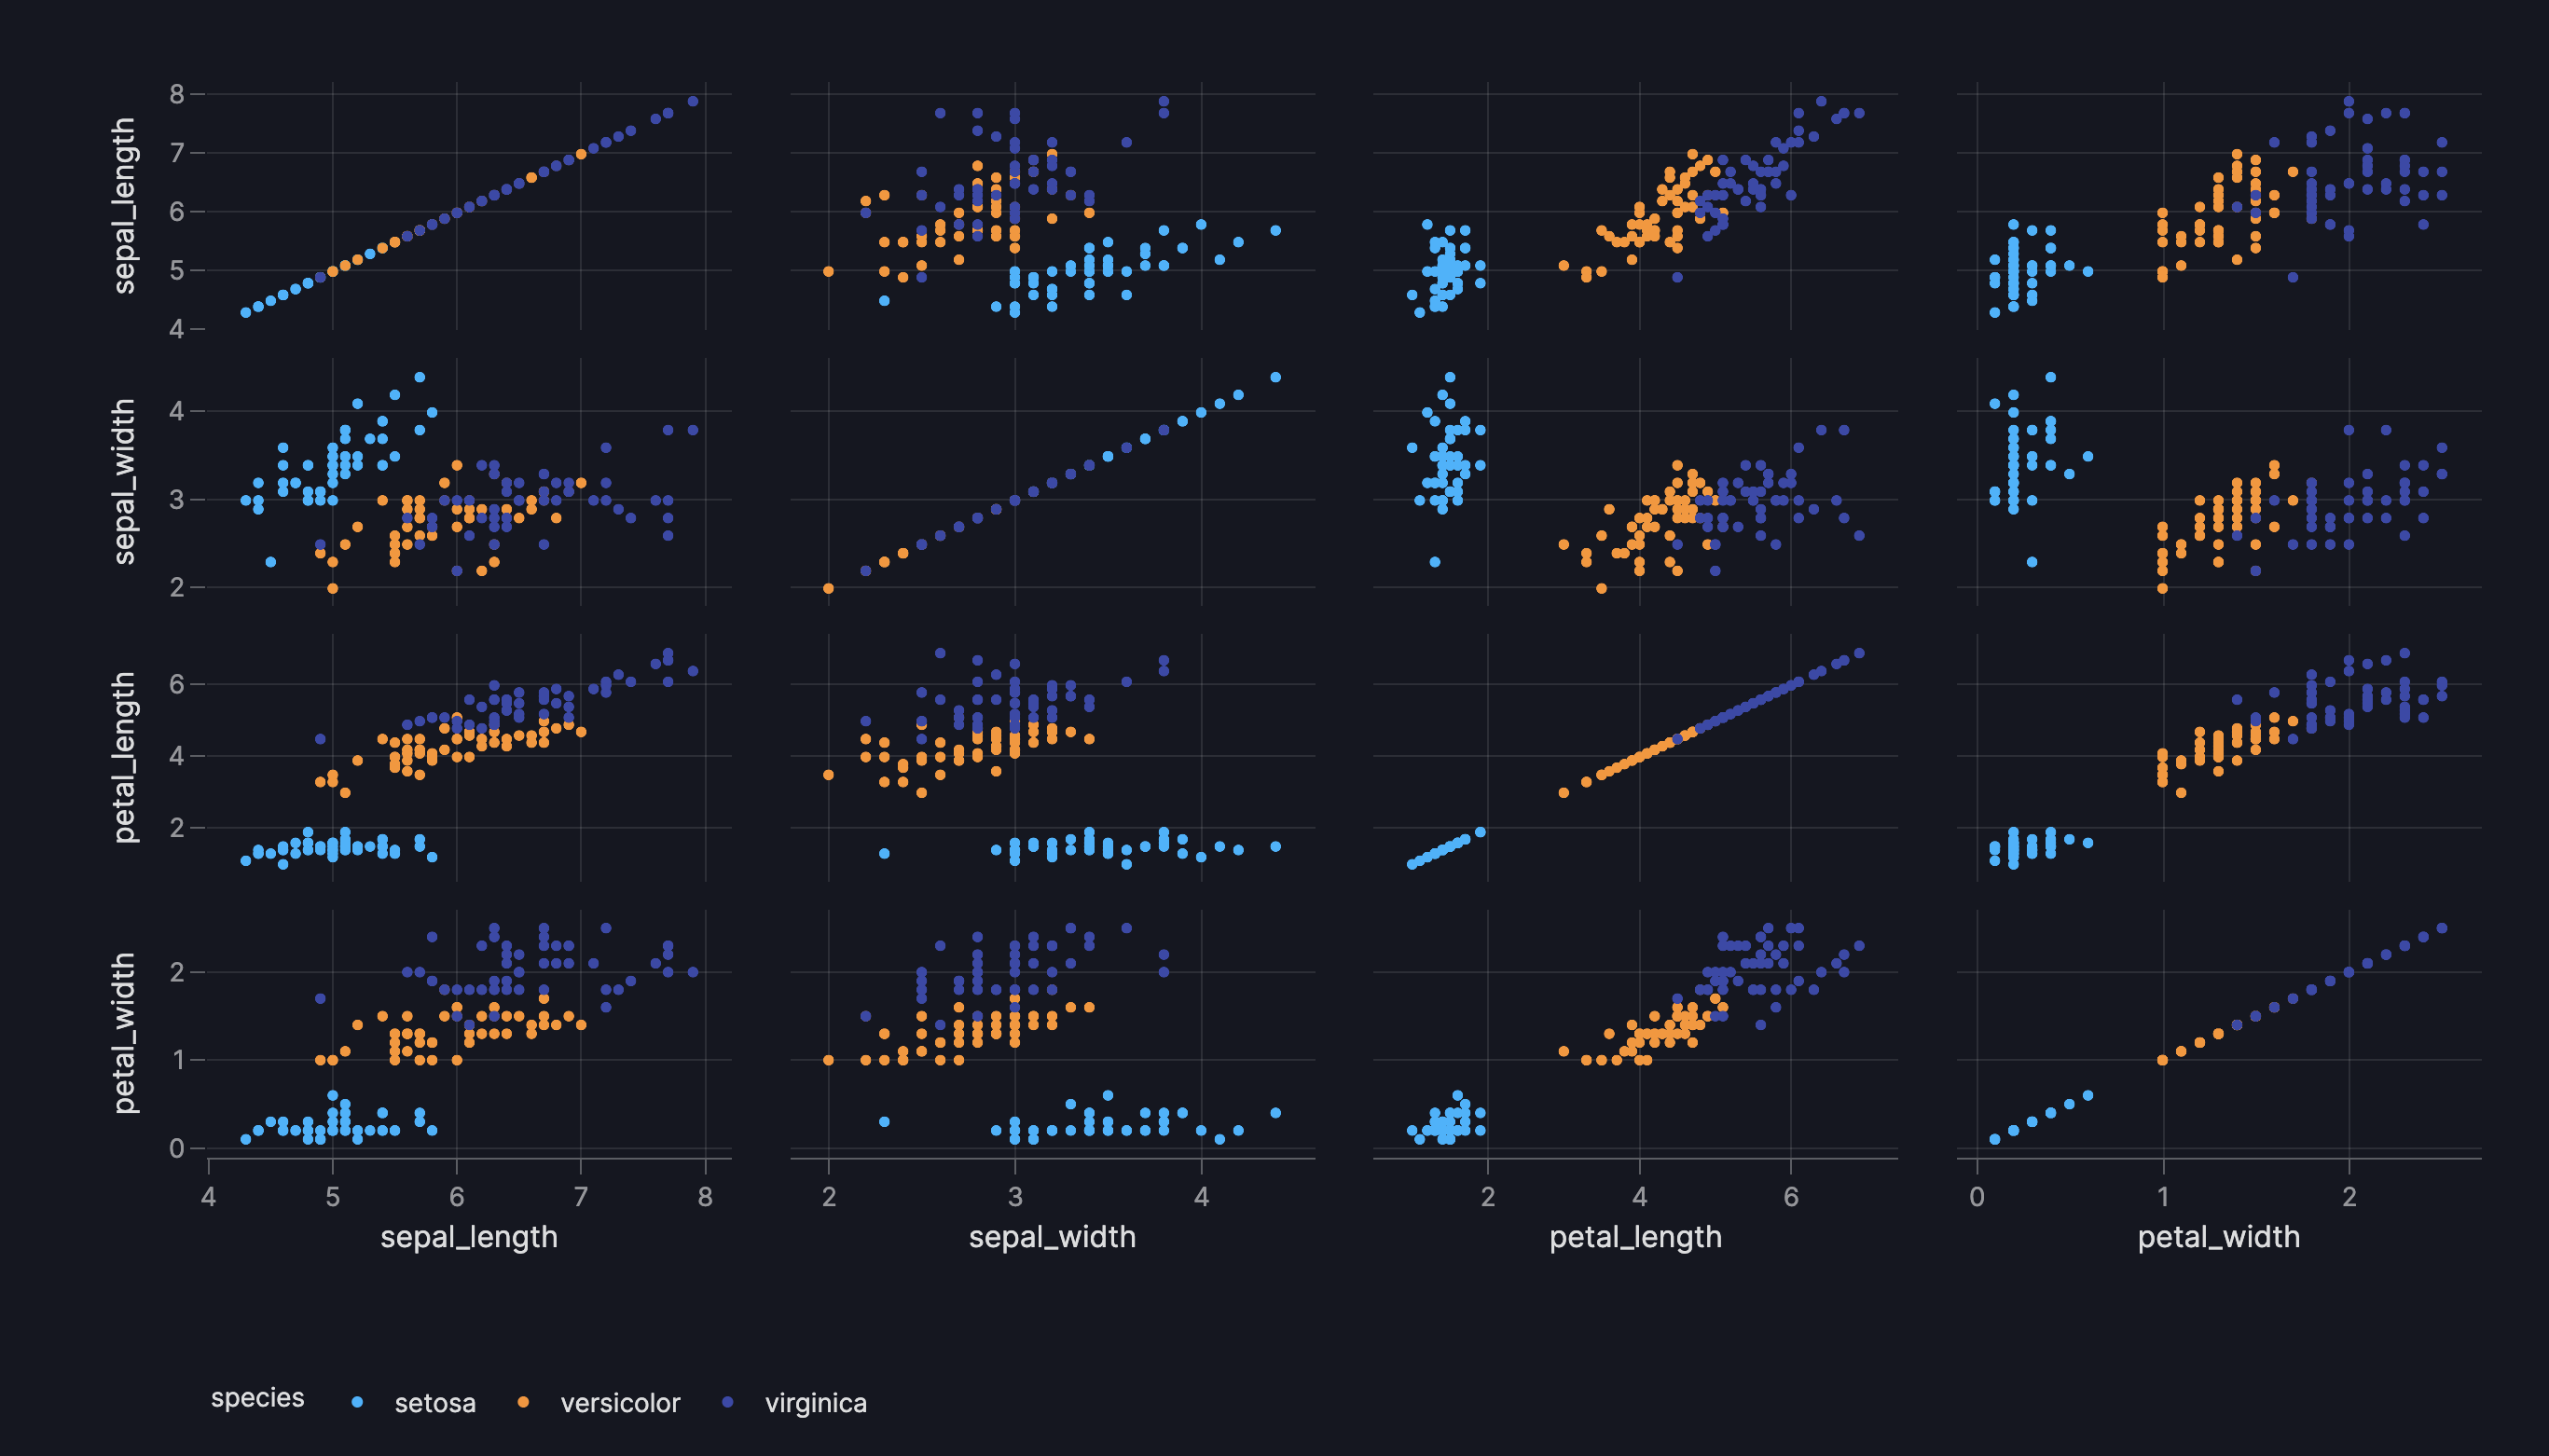
vm.Graph(
figure=px.scatter_matrix(
df, dimensions=["sepal_length", "sepal_width", "petal_length", "petal_width"], color="species"
),
),
],
controls=[vm.Filter(column="species", selector=vm.Dropdown(title="Species"))],
)
dashboard = vm.Dashboard(pages=[page])
Vizro().build(dashboard).run()
# Still requires a .py to add data to the data manager and parse YAML configuration
# See yaml_version example
pages:
- components:
  - figure:
      _target_: scatter_matrix
      color: species
      data_frame: iris
      dimensions: ["sepal_length", "sepal_width", "petal_length", "petal_width"]
    type: graph
  controls:
    - column: species
      type: filter
      selector:
        title: Species
        type: dropdown
  title: My first page
In the Python example we directly inserted the pandas DataFrame df into figure=px.scatter_matrix(df, ...). This is one way to connect a chart to data. For the YAML version, we refer to the data source by name as data_frame: iris. For a full explanation of the different methods you can use to send data to your dashboard, see our guide to using data in Vizro.
Vizro automatically sets the plotly default template
When importing Vizro, we automatically set the plotly default template to
a custom designed template. In case you would like to set the default back, simply run
plotly.express chart as template="plotly" on a case-by-case basis.
Note that we do not recommend the above steps for use in dashboards, as other templates will look out-of-sync with overall dashboard design.