FAQs
Here are some answers to frequently asked questions:
- Which browsers does Vizro support?
- What is the Vizro versioning policy?
- Why should I use Vizro?
- How does Vizro differ from Dash or Streamlit?
- How does Vizro compare with Python packages and business intelligence (BI) tools?
- When would an alternative to Vizro be more suitable?
Which browsers does Vizro support?
Vizro supports the Chrome browser. Other browsers may work, but are not officially supported.
What is the Vizro versioning policy?
This project adheres to semantic versioning. We do not consider frontend changes (such as changing the appearance of a component) to be breaking changes.
Note
While being in version 0.x.x, we may introduce breaking changes in minor versions.
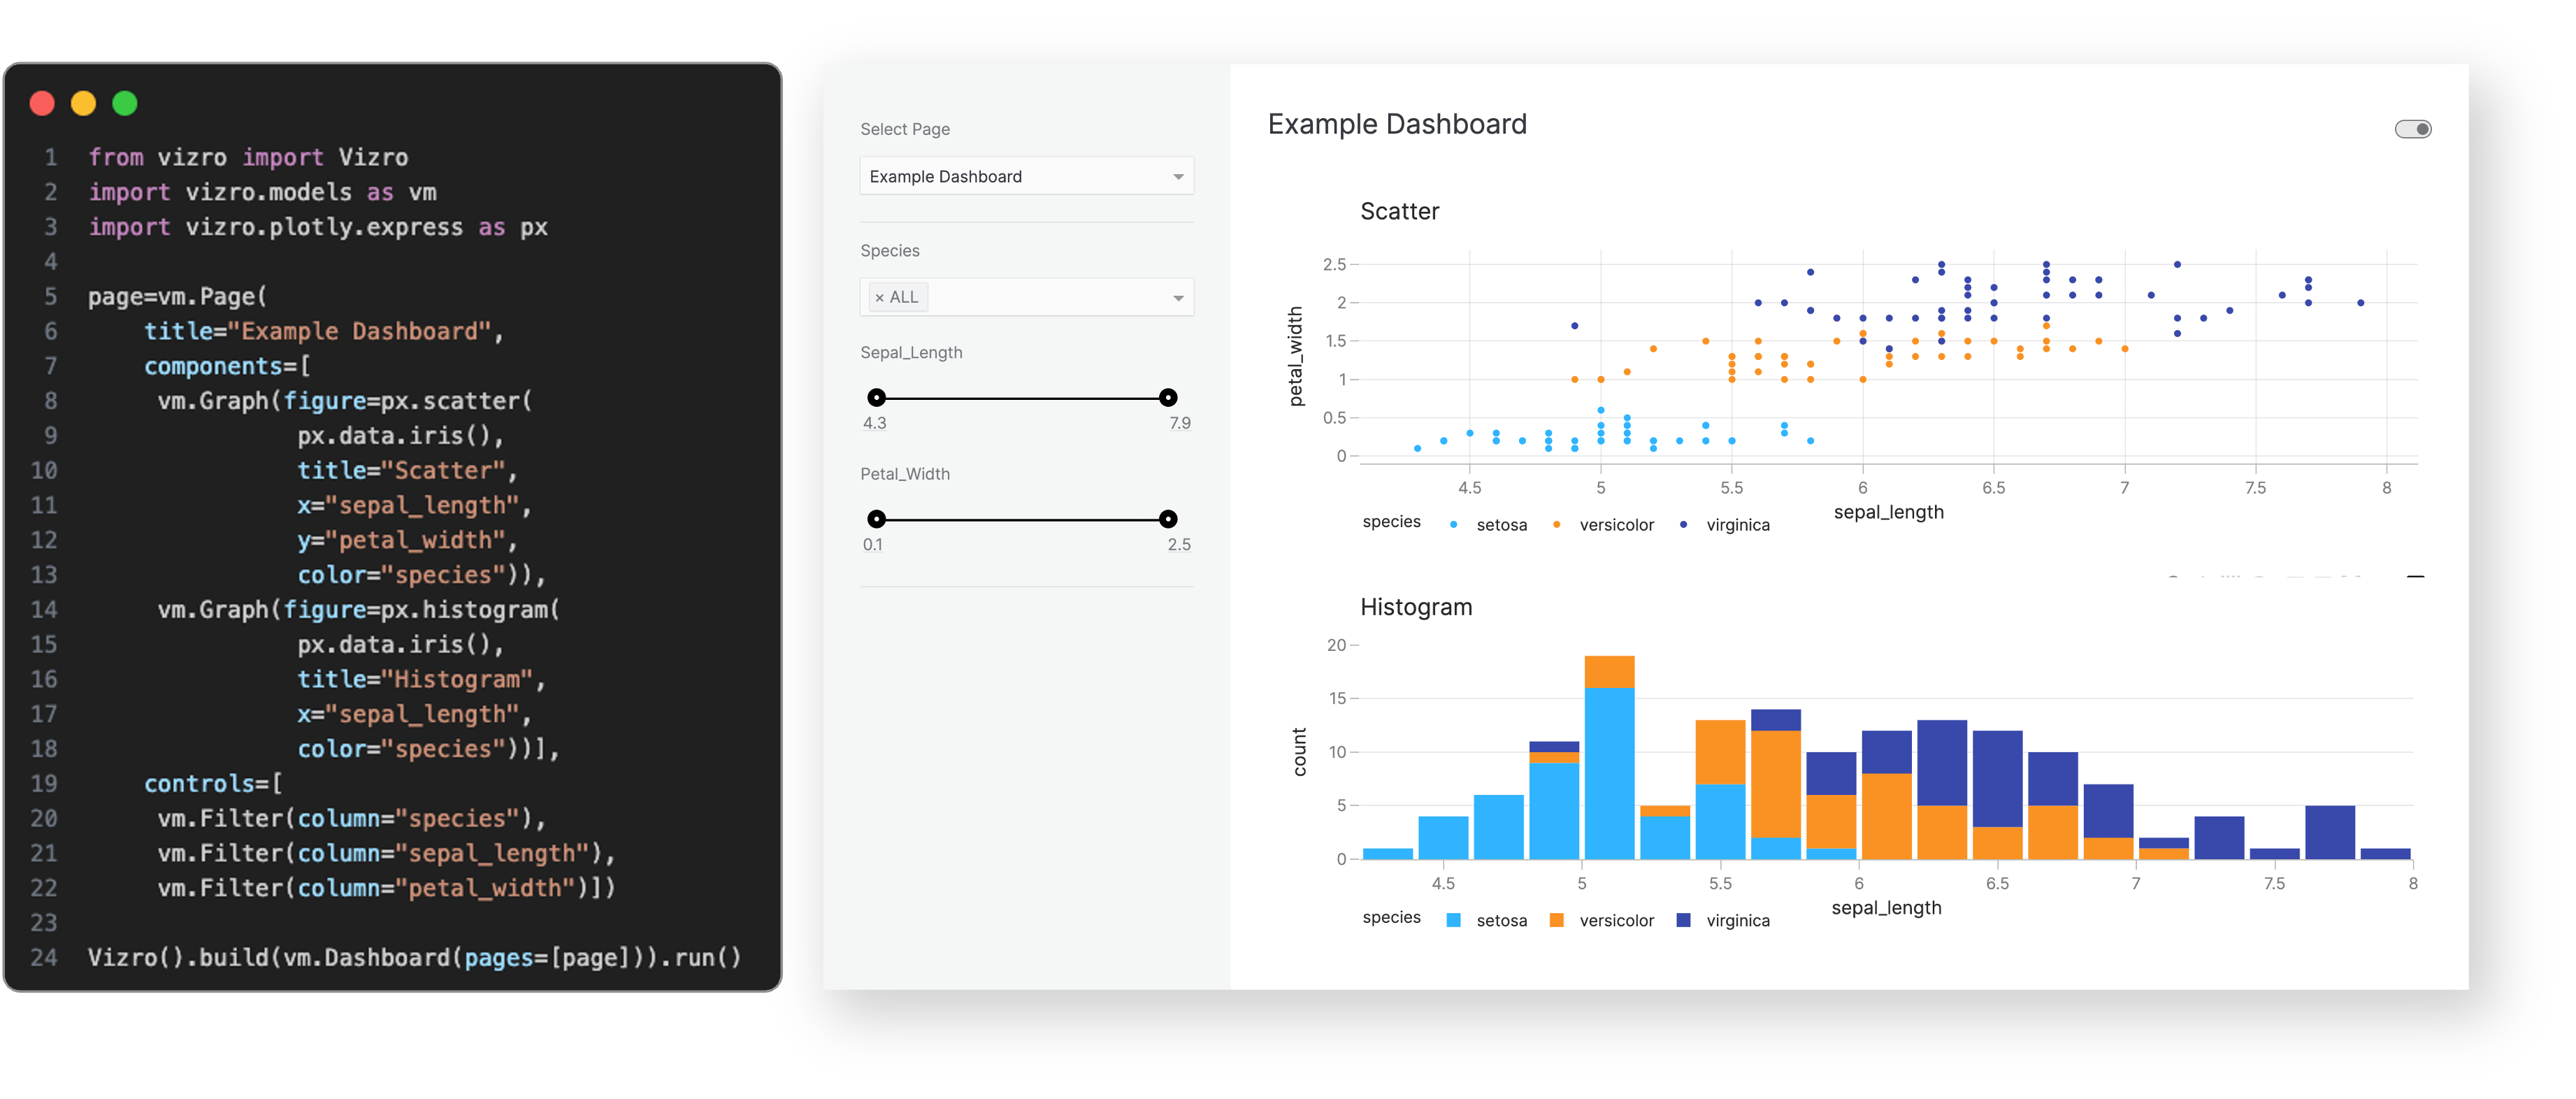
Why should I use Vizro?
Vizro is a high-level framework built on top of Dash and Pydantic, which makes it easier to build advanced dashboards since it automates many of the otherwise complex and time-consuming tasks traditionally associated with designing, building and deploying front-end applications, from prototypes to production.
You can build beautiful & powerful dashboards, quickly & easily
Users can configure Vizro dashboards without needing to know advanced software development principles, nor how to build front-end applications.
See more details
- Beautiful - inbuilt visual design best practices are applied automatically, so users can create beautiful dashboards without needing to know any HTML, CSS or design principles.
- Powerful - advanced functionality and interactions come out-of-the-box, by using just a few lines of simple configuration.
- Quick and easy - the simple configuration follows an intuitive "grammar of dashboards" which is quick to learn and easy to use. This removes most of the "glue code" that would otherwise need to be written. Thousands of lines of code are reduced to tens of lines of configuration. Users can configure Vizro dashboards without needing to know any advanced software development principles of how to build front-end applications.
You can extend and customize infinitely
Users benefit from the power of the Dash framework and the flexibility of React.
See more details
- Dash - since Vizro is built on top of Dash, then users benefit from all the underlying power and customizations offered by the Dash framework, including the ability to use extension libraries related to Dash.
- React - since Dash enables JavaScript React components to be incorporated into Dash applications, Vizro users can create custom charts and UI components which offer the infinite flexibility of React.
- Vizro extensions - adding extensions such as user defined custom charts, components, actions and data connectors is intuitively incorporated into the configuration language of Vizro.
You can rapidly scale from prototypes to production deployment
Consistency and re-usability designed for scale.
See more details
- Prototype rapidly - even complex dashboards can be created within minutes using Vizro, which enables prototype dashboards to be created and iterated on quickly and easily, with very low barrier to entry.
- Deploy easily - since Vizro is built on Dash which uses Flask, it is simple to deploy Vizro like any other Dash application, and use application servers such as Gunicorn to scale to multiple users.
- Scale - since Vizro offers standardization of visual design, application architecture and configuration language, it is easier to scale across multiple developers, projects and implementations in a consistent and reusable way.
How does Vizro differ from Dash or Streamlit?
Potential users sometimes request comparisons between Vizro and similar tools such as Dash and Streamlit. In many ways a direct comparison is not possible as these products tackle somewhat different use cases and their relative pros and cons change depending on the particular requirements of each different user.
Any attempt at a high-level explanation must rely on an oversimplification that misses many important nuances. With the caveat that it's not possible to "compare apples with pears", and that any comparison will have a different conclusion for different users, an oversimplified view could be:
Streamlit is great for rapid prototyping
- rapid prototyping - Streamlit's architecture allows you to write apps the same way you write plain Python scripts. To unlock this, Streamlit apps have a unique data flow: any time something must be updated on the screen, Streamlit reruns your entire Python script from top to bottom. [1] This turns data scripts into sharable web apps in minutes. [2] Adding a widget is the same as declaring a variable. (No need to write a backend, define routes, handle HTTP requests, connect a frontend, write HTML, CSS, JavaScript, etc. [3])
Dash is great for customization and scalability
- customization - one of the great things about Dash is that it is built on top of React.js, a JavaScript library for building web components. Thousands of components have been built and released with open source licenses by the React community, any of which could be adapted into a Dash component. [4] Dash supports adding custom CSS [5] and HTML, callbacks for custom behavior, and many component libraries such as Dash Bootstrap components [6]
- scalability - based on Flask which is widely adopted by the Python community and deployed in production environments everywhere [7] Dash was designed to be a stateless framework. Stateless frameworks are more scalable and robust [8]
Vizro is great for combining rapid prototyping with customization and scalability
- rapid prototyping - since Vizro is a high-level framework providing declarative configuration, it is quick and easy to create powerful interactive apps in minutes, without needing to write callbacks, HTML, CSS, or JavaScript. Key topics such as applying state management, application architecture, and testing are done automatically by Vizro.
- customization and scalability - since Vizro is built on top of Dash, then users benefit from all the underlying power of the Dash framework for customization and scalability
- beauty and robustness - since Vizro uses inbuilt visual design and software development best practices, it automatically generates dashboards which look beautiful and can go from prototype to production quickly and easily
All are great entry points to the world of data apps. If you prefer a top-down scripting style, then Streamlit is a powerful approach. If you prefer full control and customization over callbacks and layouts, then Dash is a powerful approach. If you prefer a configuration approach with in-built best practices, and the potential for customization and scalability through Dash, then Vizro is a powerful approach.
For a more detailed comparison, it may help to visit the introductory articles of Dash, Streamlit and Vizro, to see how each tool serves a distinct purpose, and could be the best tool of choice.
How does Vizro compare with Python packages and business intelligence (BI) tools?
There are a number of Python packages and BI tools which offer support for visualization applications (such as Streamlit, Plotly/Dash, Tableau and PowerBI).
Vizro is intended to support several niches between the benefits from those tools, rather than being in direct comparison with any single tool. Therefore, direct comparisons are often only partially suitable, given the many features offered across this landscape.
However, in general, there are several areas of functionality where Vizro can be particularly useful, such as in providing a simple configuration to speed up the assembly of components, leveraging inbuilt visual design, application architecture, and coding standards, along with the ability to scale easily across multiple developers and implementations.
See more details
| Functionality | Benefits | In context of Python packages | In context of BI tools |
|---|---|---|---|
Assembly system
|
|
Many Python packages still require a moderate understanding of the coding required to assemble higher-level dashboard concepts, which necessitates the creation of “glue code” to combine lower-level components. Vizro primarily offers configuration to simplify that assembly of components offered by existing packages (currently leveraging Plotly/Dash), and so occupies a slightly different niche from libraries offering primarily the lower-level components themselves. It also removes the requirement from users to implement certain code standards for the assembled code themselves, and therefore saves time on often time consuming things such as writing unit tests and ensuring linting coverage. |
Many BI tools incorporate the assembly of higher-level concepts automatically from GUI (drop-and-drag) interfaces, and occupy a slightly different niche to the configuration driven assembly offered by Vizro. |
Inbuilt visual design decisions
|
|
Many Python packages offer inbuilt color choices, and visual design choices for certain components. Vizro applies that to a wide range of component combinations and complex user flows, offering a holistic and comprehensive approach to automatically enable beautiful visual design best practices, whilst allowing customization and flexibility. |
Many BI tools supply inbuilt color choices and visual design choices for certain components. Vizro offers inbuilt visual design for components in addition to the ability to customize them in a flexible way where needed (for example through CSS), and automatic arrangement of components on the screen. |
Inbuilt application architecture decisions
|
|
Many Python packages supply inbuilt application architecture choices for certain functionalities. Vizro applies that to a wide range of component combinations and complex user flows, offering a holistic and comprehensive approach to the entire application architecture, whilst allowing customization and flexibility where relevant. |
Many BI tools apply proprietary application architecture by default. Vizro enables the user to view and understand the application architecture by directly viewing the code. |
Declarative configuration, in multiple formats
|
|
Many Python packages give a mostly declarative configuration, with limited ability to leverage multiple formats such as Pydantic models and JSON. Vizro simplifies this approach, and facilitates the extension of the assembly system to enable integration with other tools such as Kedro to programmatically and dynamically generate the relevant dashboard configurations in a streamlined way. |
Many BI tools solely use a GUI and/or drag-and-drop interface for defining dashboards, and leverage proprietary configuration formats. Vizro enables the user to view and understand the configuration by viewing it directly, in addition to being able to edit it directly. |
Mostly tech agnostic “grammar of dashboards”
|
|
Many Python packages supply an effective “grammar of charts” and Python specific declaration. Vizro offers a “grammar of dashboards” with declaration which is largely tech agnostic and can be extended to non-Python languages. |
Many BI tools utilize an implicit internal “grammar of dashboards” which is specific to the proprietary language(s) on with which they are built. Vizro offers an explicit configuration grammar and allows users to leverage a mostly tech agnostic approach (which can be extended in future). |
Inbuilt validation
|
|
Many Python packages supply individual components or non-Pydantic based models. Vizro offers the advantages of Pydantic based models for many elements of the configuration process, which leverages the validation and guidance inherent in that process to facilitate implementation by users. |
Many BI tools have inbuilt guideline systems to ensure components are combined in a valid way, and give feedback to the manual user to help guide through that process. Vizro utilizes a flexible system which can be extended to give feedback to programmatic generation of configuration. |
Modularity
|
|
Many Python packages support modularity of components such as charts and controls. Vizro supports modularity of groups of components (such as their implementation together as a dashboard screen), which can be easily transferred between implementations as configuration. |
Many BI tools supply extensions and plugins which support modularity of visualizations. Vizro supports modularity of groups of components (such as their implementation together as a dashboard screen), which can be easily transferred between implementations as configuration. |
Flexibility
|
|
Many Python packages offer some low-code and/or high-code approaches, which offer varying degrees of flexibility. Vizro supports a holistic combination of low-code and high-code approaches which support less technical and more technical users individually while allowing them much flexibility in implementation according to their technical level. |
Many BI tools offer a no-code (or at least low-code) approach to creating charts and dashboards, along with varying forms of plugins to increase flexibility. Vizro unlocks Python custom functions to be able to power this user driven flexibility in a technically advanced way, with a high degree of control and visibility over the code, whilst also supporting less technical users through low-code configuration. |
Scaling
|
|
Many Python packages benefit from the ability to propagate updates programmatically, while applying that to “glue code”. Vizro makes it easy to scale by replicating the relatively small amount of configuration in 1 file between usages, rather than replicating a large amount of code across many files between usages. Updating configuration programmatically from a central location is often easier than updating code. When sharing between users, it can be easier to inherit and understand configuration than the underlying code. The visual consistency makes it easier to scale within or between projects while maintaining visual coherence. |
Many BI tools allow scaling through GUI drag-and-drop interfaces (having some functionality for duplication or propagating changes) for single users. Vizro makes it easy to leverage tools such as Git to enable almost any number of users to collaborate effectively, therefore allowing the number of developers on a single project to scale easily. Since updates can be propagated programmatically easily from a central location, it allows scaling across almost any number of related implementations which can be kept up to date and aligned without the need to manually adjust each implementation when updates are required. |
Python first
|
|
Python packages are already Python focused. Vizro is no different in this respect. By leveraging Plotly/Dash, Vizro is also able to benefit from the power and flexibility offered by JavaScript via React, whilst still presenting a format that is Python first to the user (by making use of the ability offered by Dash to effectively wrap those components into Python). |
Many BI tools do not offer direct or full integration with Python. Vizro supports a Python first approach which leverages the power and flexibility of Python, and the open source community supporting that wide ranging functionality. |
Open source
|
|
Many Python packages also use an open source license, and offer ongoing development and maintenance. Vizro is no different in this respect. |
Many BI tools follow a license fee model and/or charge for ongoing development and maintenance. Vizro requires no license fee, and offers ongoing development and support, which helps to remove some barriers to usage. |
When would an alternative to Vizro be more suitable?
There are a number of cases where alternatives to Vizro may be more suitable, including:
-
where BI tools are already in heavy use and working well, and/or Python developers are not prevalent
-
where development teams already contain designers and JavaScript (or equivalent) engineers with bandwidth to build bespoke applications (though Vizro can sometimes still be used effectively to rapidly prototype potential solutions)
-
where Python developers are already very comfortable leveraging other Python packages