How to use themes and colors
This guide shows you how to use themes. Themes are pre-designed collections of stylings that are applied to entire charts and dashboards. The themes provided by Vizro are infused with our design best practices that make charts and dashboards look visually consistent and professional.
Built-in Vizro themes (dark/light)
The Dashboard model accepts an optional theme argument, where you can choose between a vizro_dark and a vizro_light theme. If not specified then theme defaults to vizro_dark. The theme is applied to the entire dashboard and its charts/components when a user first loads your dashboard. Regardless of the theme applied on first load, users can always switch between light and dark themes via the toggle button in the upper-right corner of the dashboard.
Change theme
import vizro.models as vm
import vizro.plotly.express as px
from vizro import Vizro
df = px.data.iris()
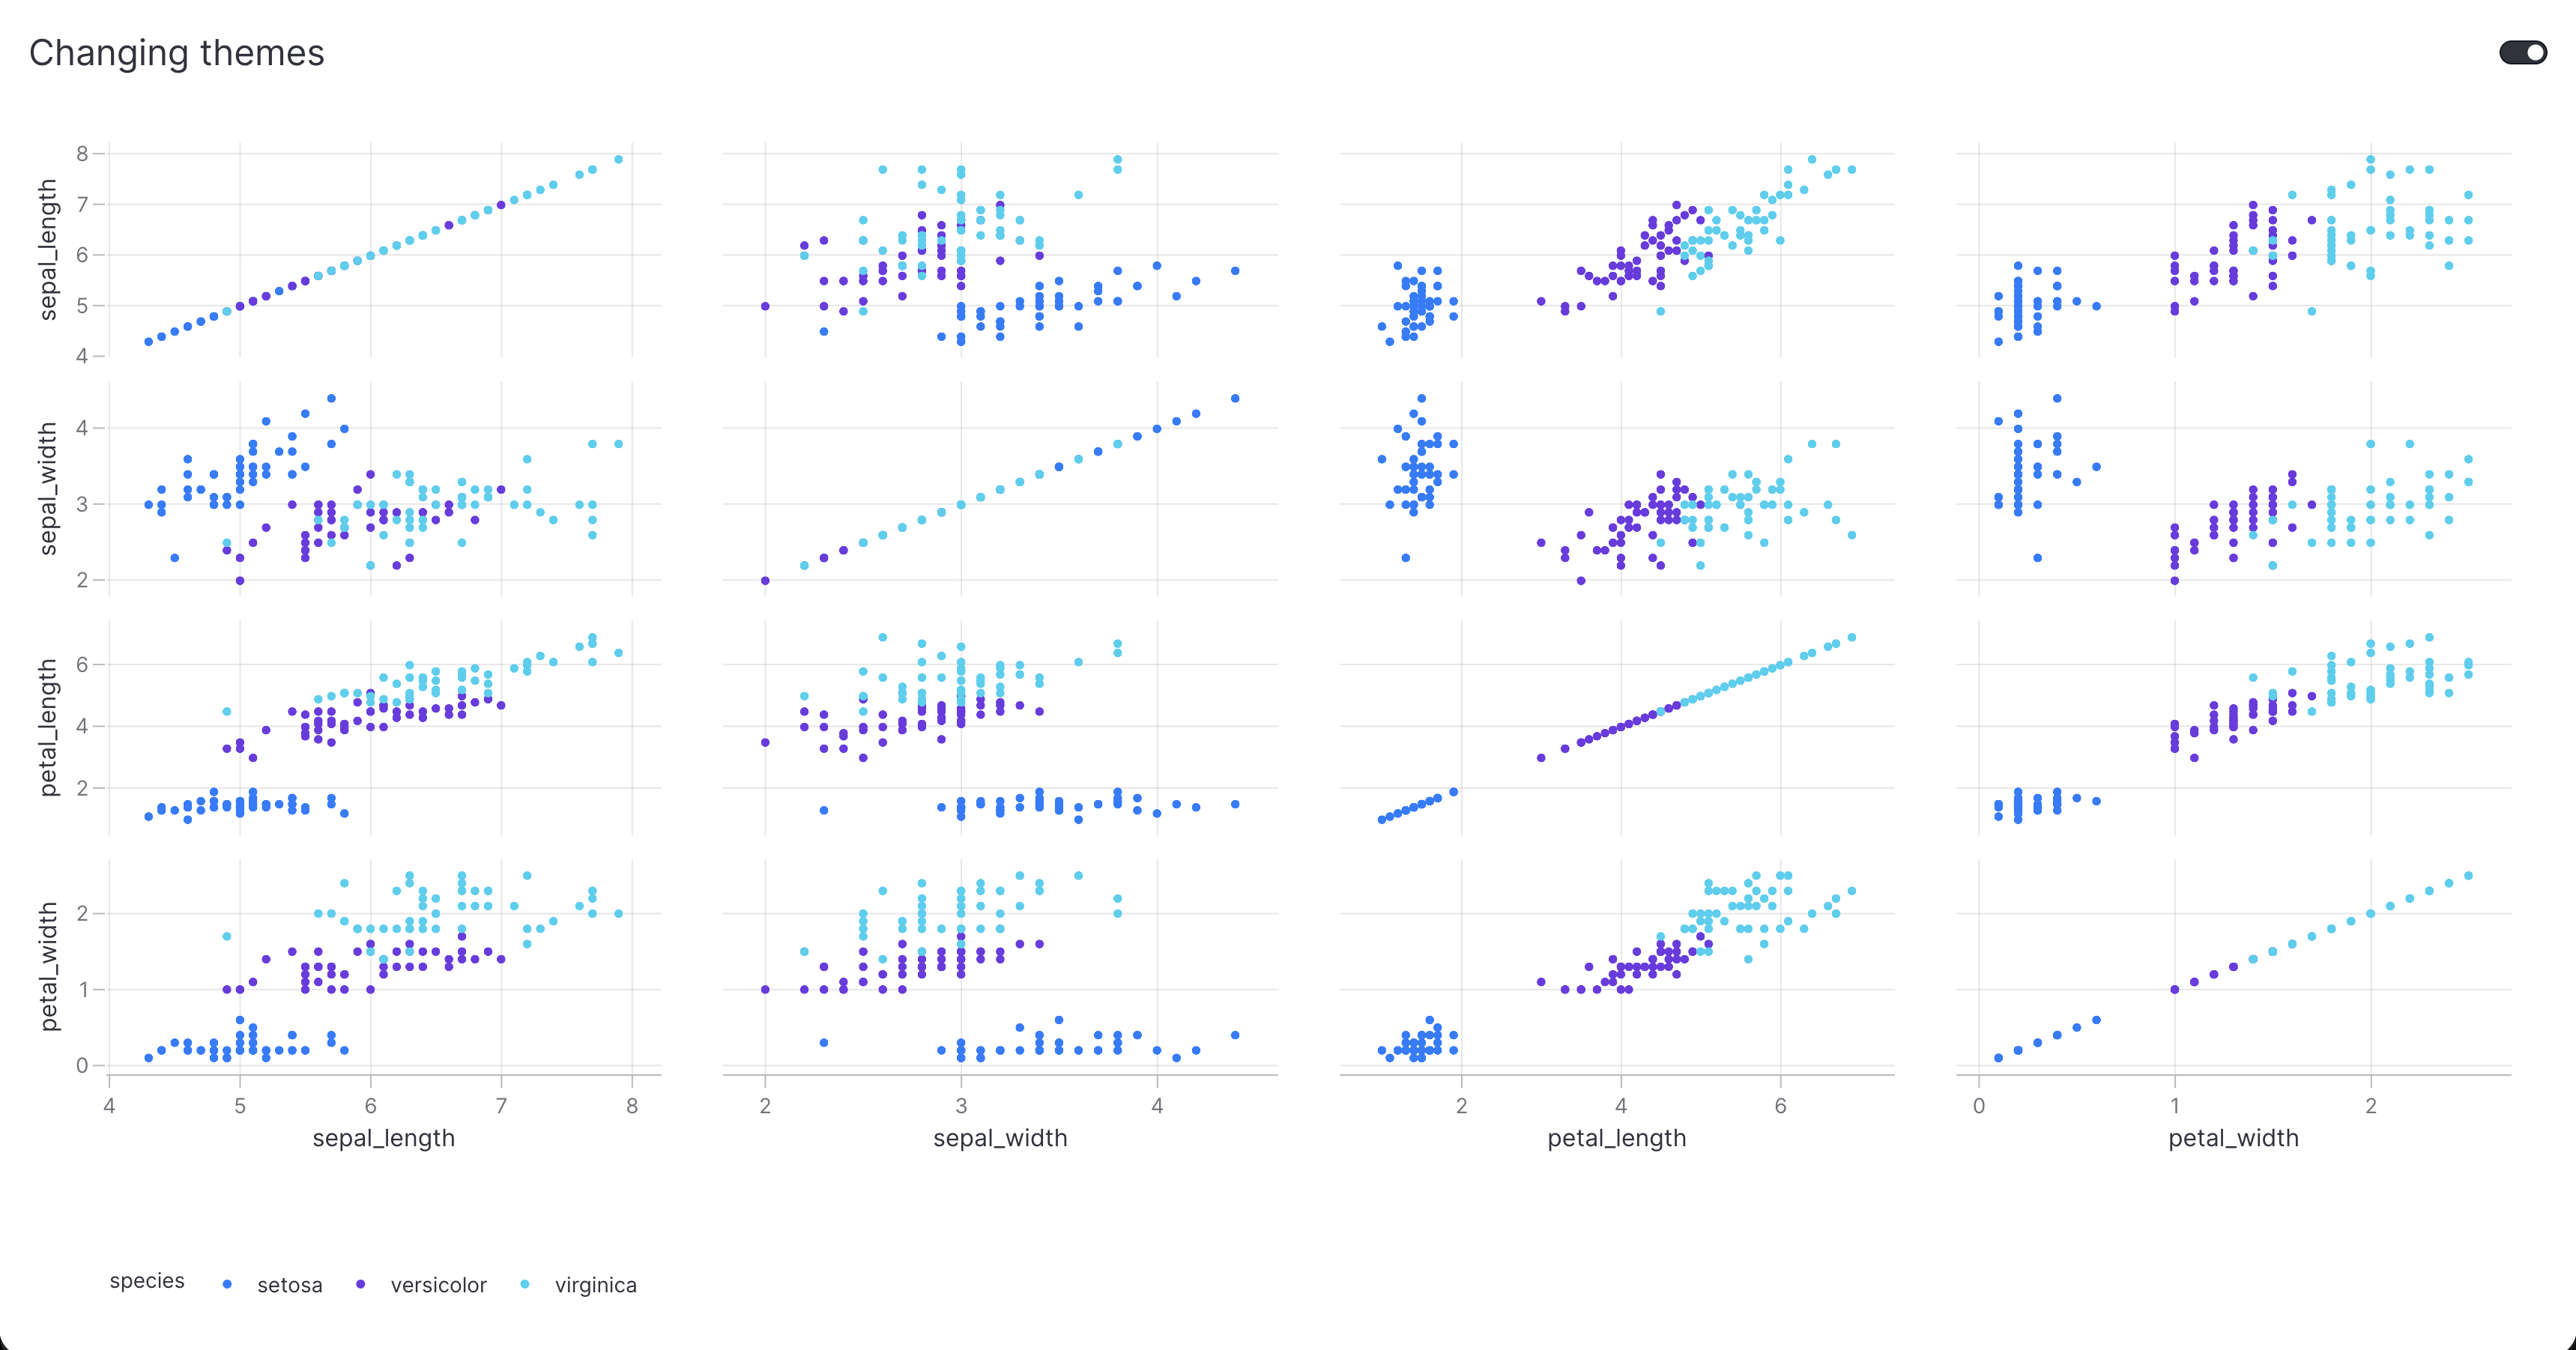
page = vm.Page(
title="Changing themes",
components=[
vm.Graph(
figure=px.scatter_matrix(
df, dimensions=["sepal_length", "sepal_width", "petal_length", "petal_width"], color="species"
),
),
],
)
dashboard = vm.Dashboard(pages=[page], theme="vizro_light")
Vizro().build(dashboard).run()
![]() Run and edit this code in Py.Cafe
Run and edit this code in Py.Cafe
# Still requires a .py to add data to the data manager and parse YAML configuration
# See yaml_version example
pages:
  - components:
      - figure:
          _target_: scatter_matrix
          color: species
          data_frame: iris
          dimensions: [sepal_length, sepal_width, petal_length, petal_width]
        type: graph
    title: Changing themes
theme: vizro_light

Custom Bootstrap themes
If you would like to change the default Vizro styling, you have two options:
- Apply custom CSS to override specific properties. See our guide on customizing CSS for full details.
- Load a completely different Bootstrap theme.
Vizro is primarily built out of Dash Bootstrap components, which means you can customize the appearance by providing your own Bootstrap theme via the Vizro(external_stylesheets=...). When you specify an external Bootstrap stylesheet, Vizro will use your custom theme instead of its default styling. You can explore available Bootstrap themes in the Dash Bootstrap Components theme gallery.
Use bootstrap theme
import vizro.models as vm
import vizro.plotly.express as px
from vizro import Vizro
import dash_bootstrap_components as dbc
df = px.data.iris()
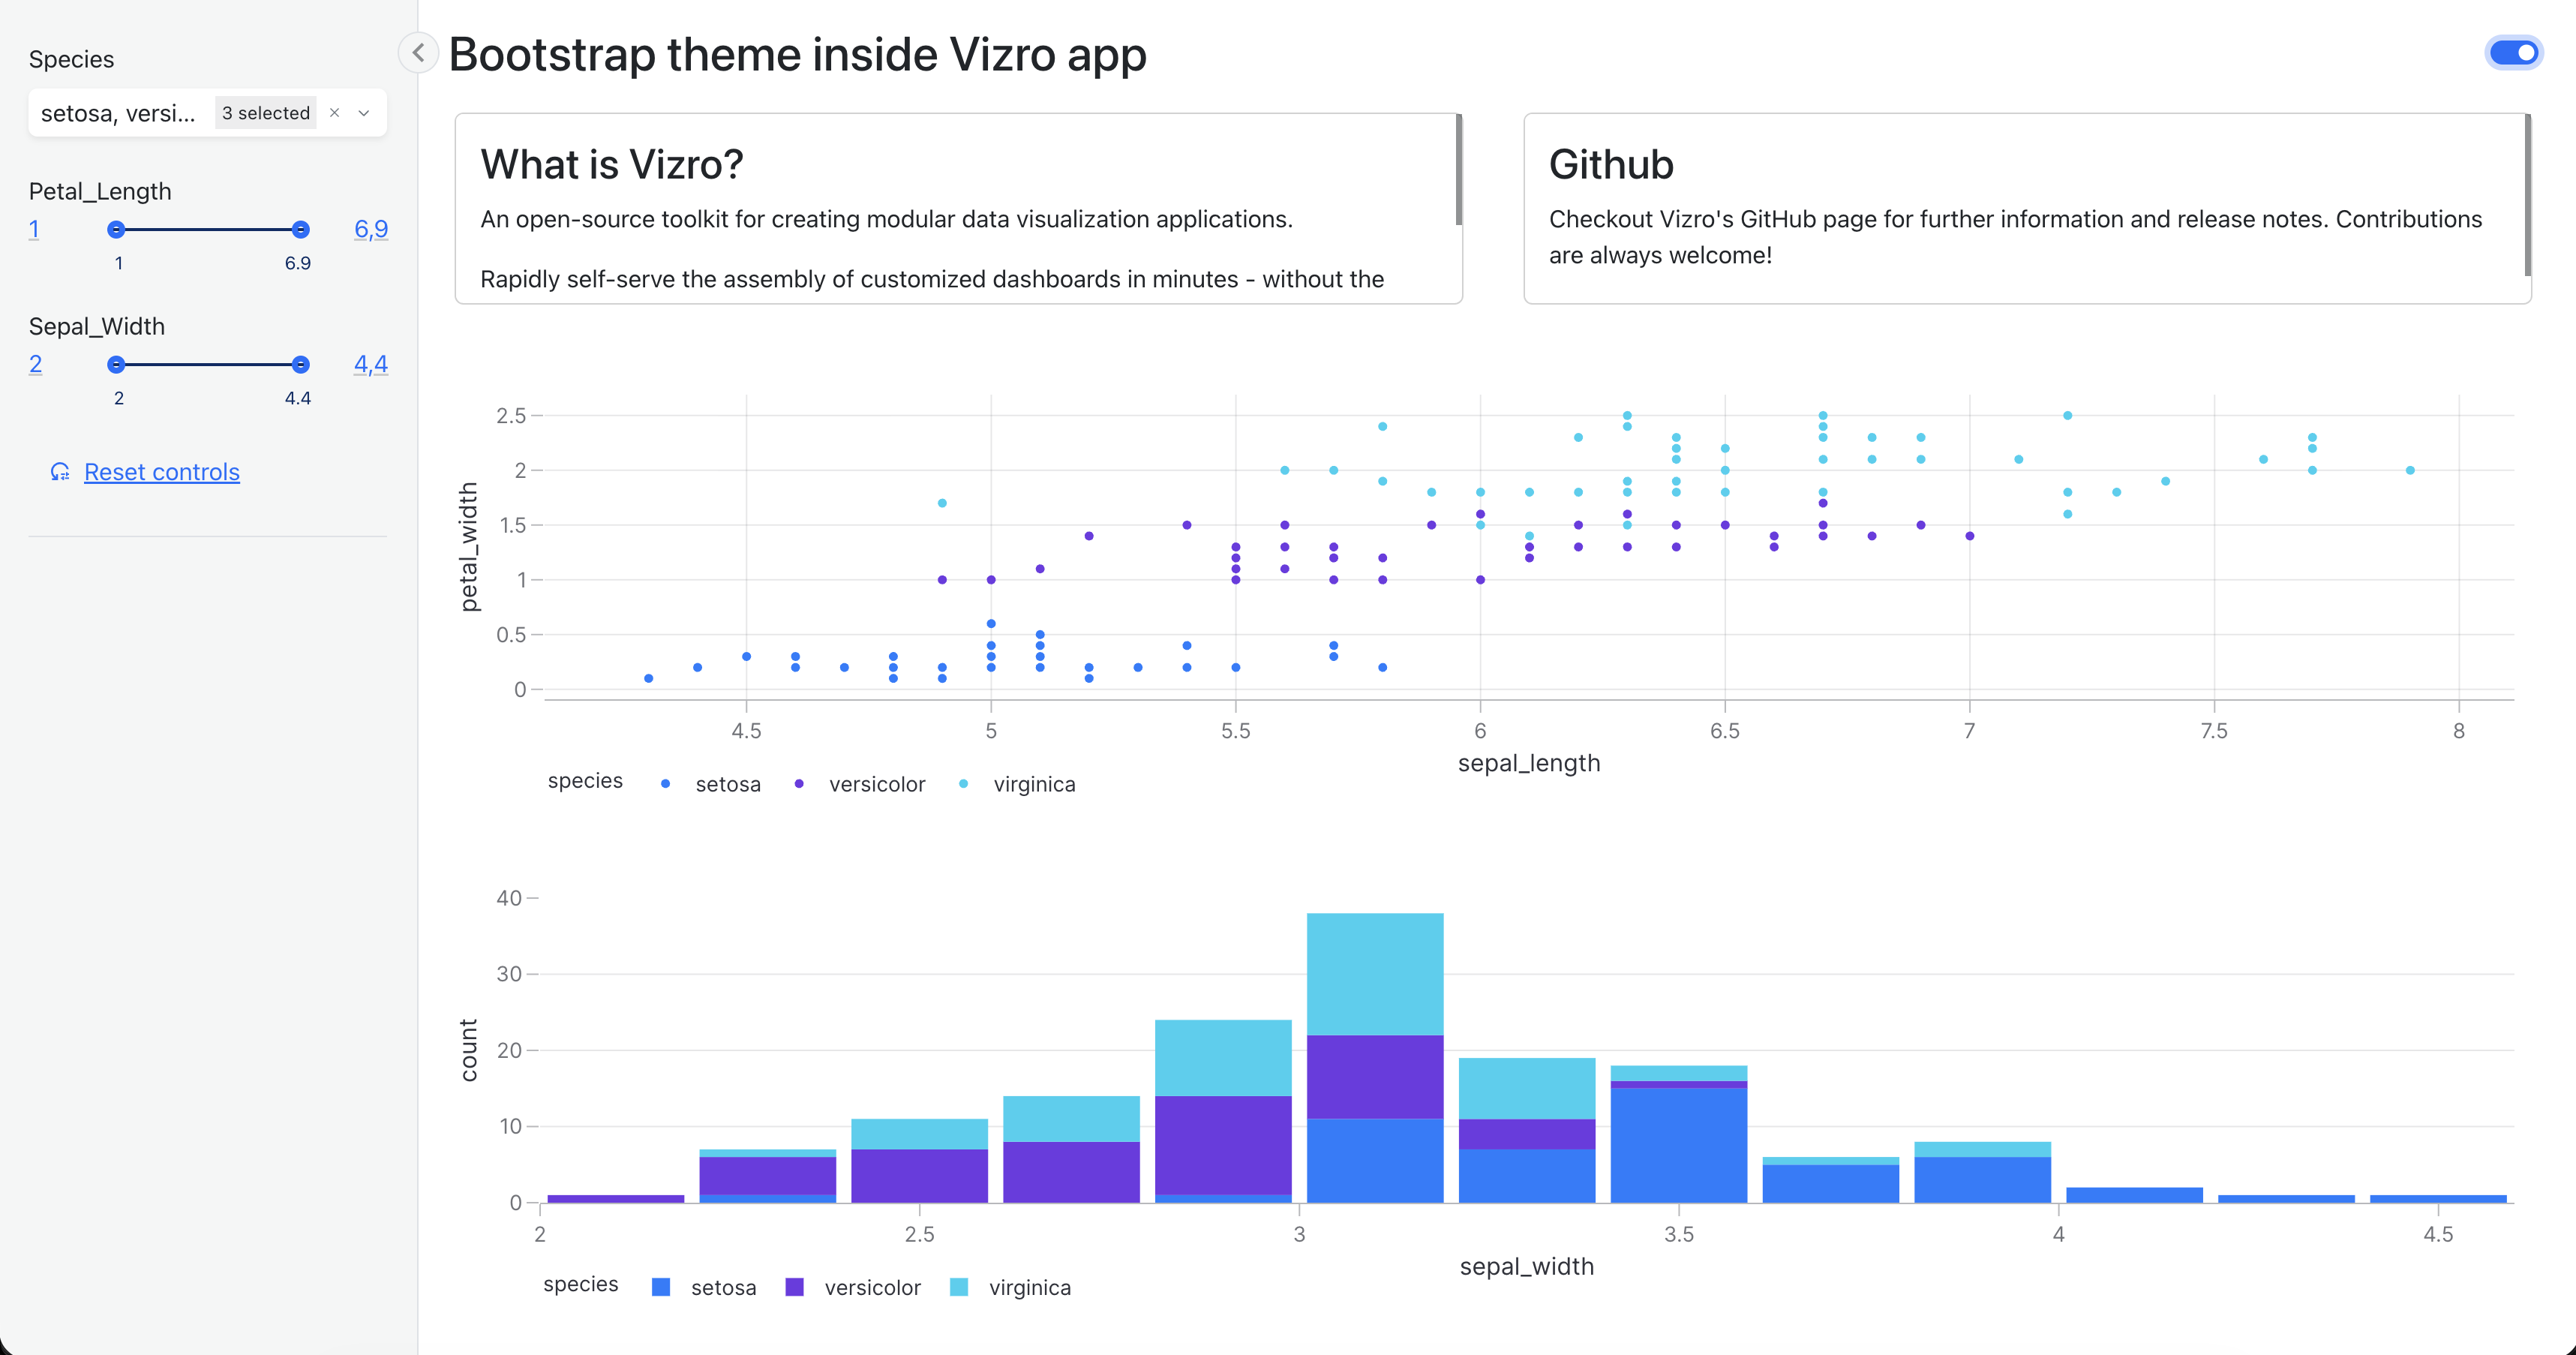
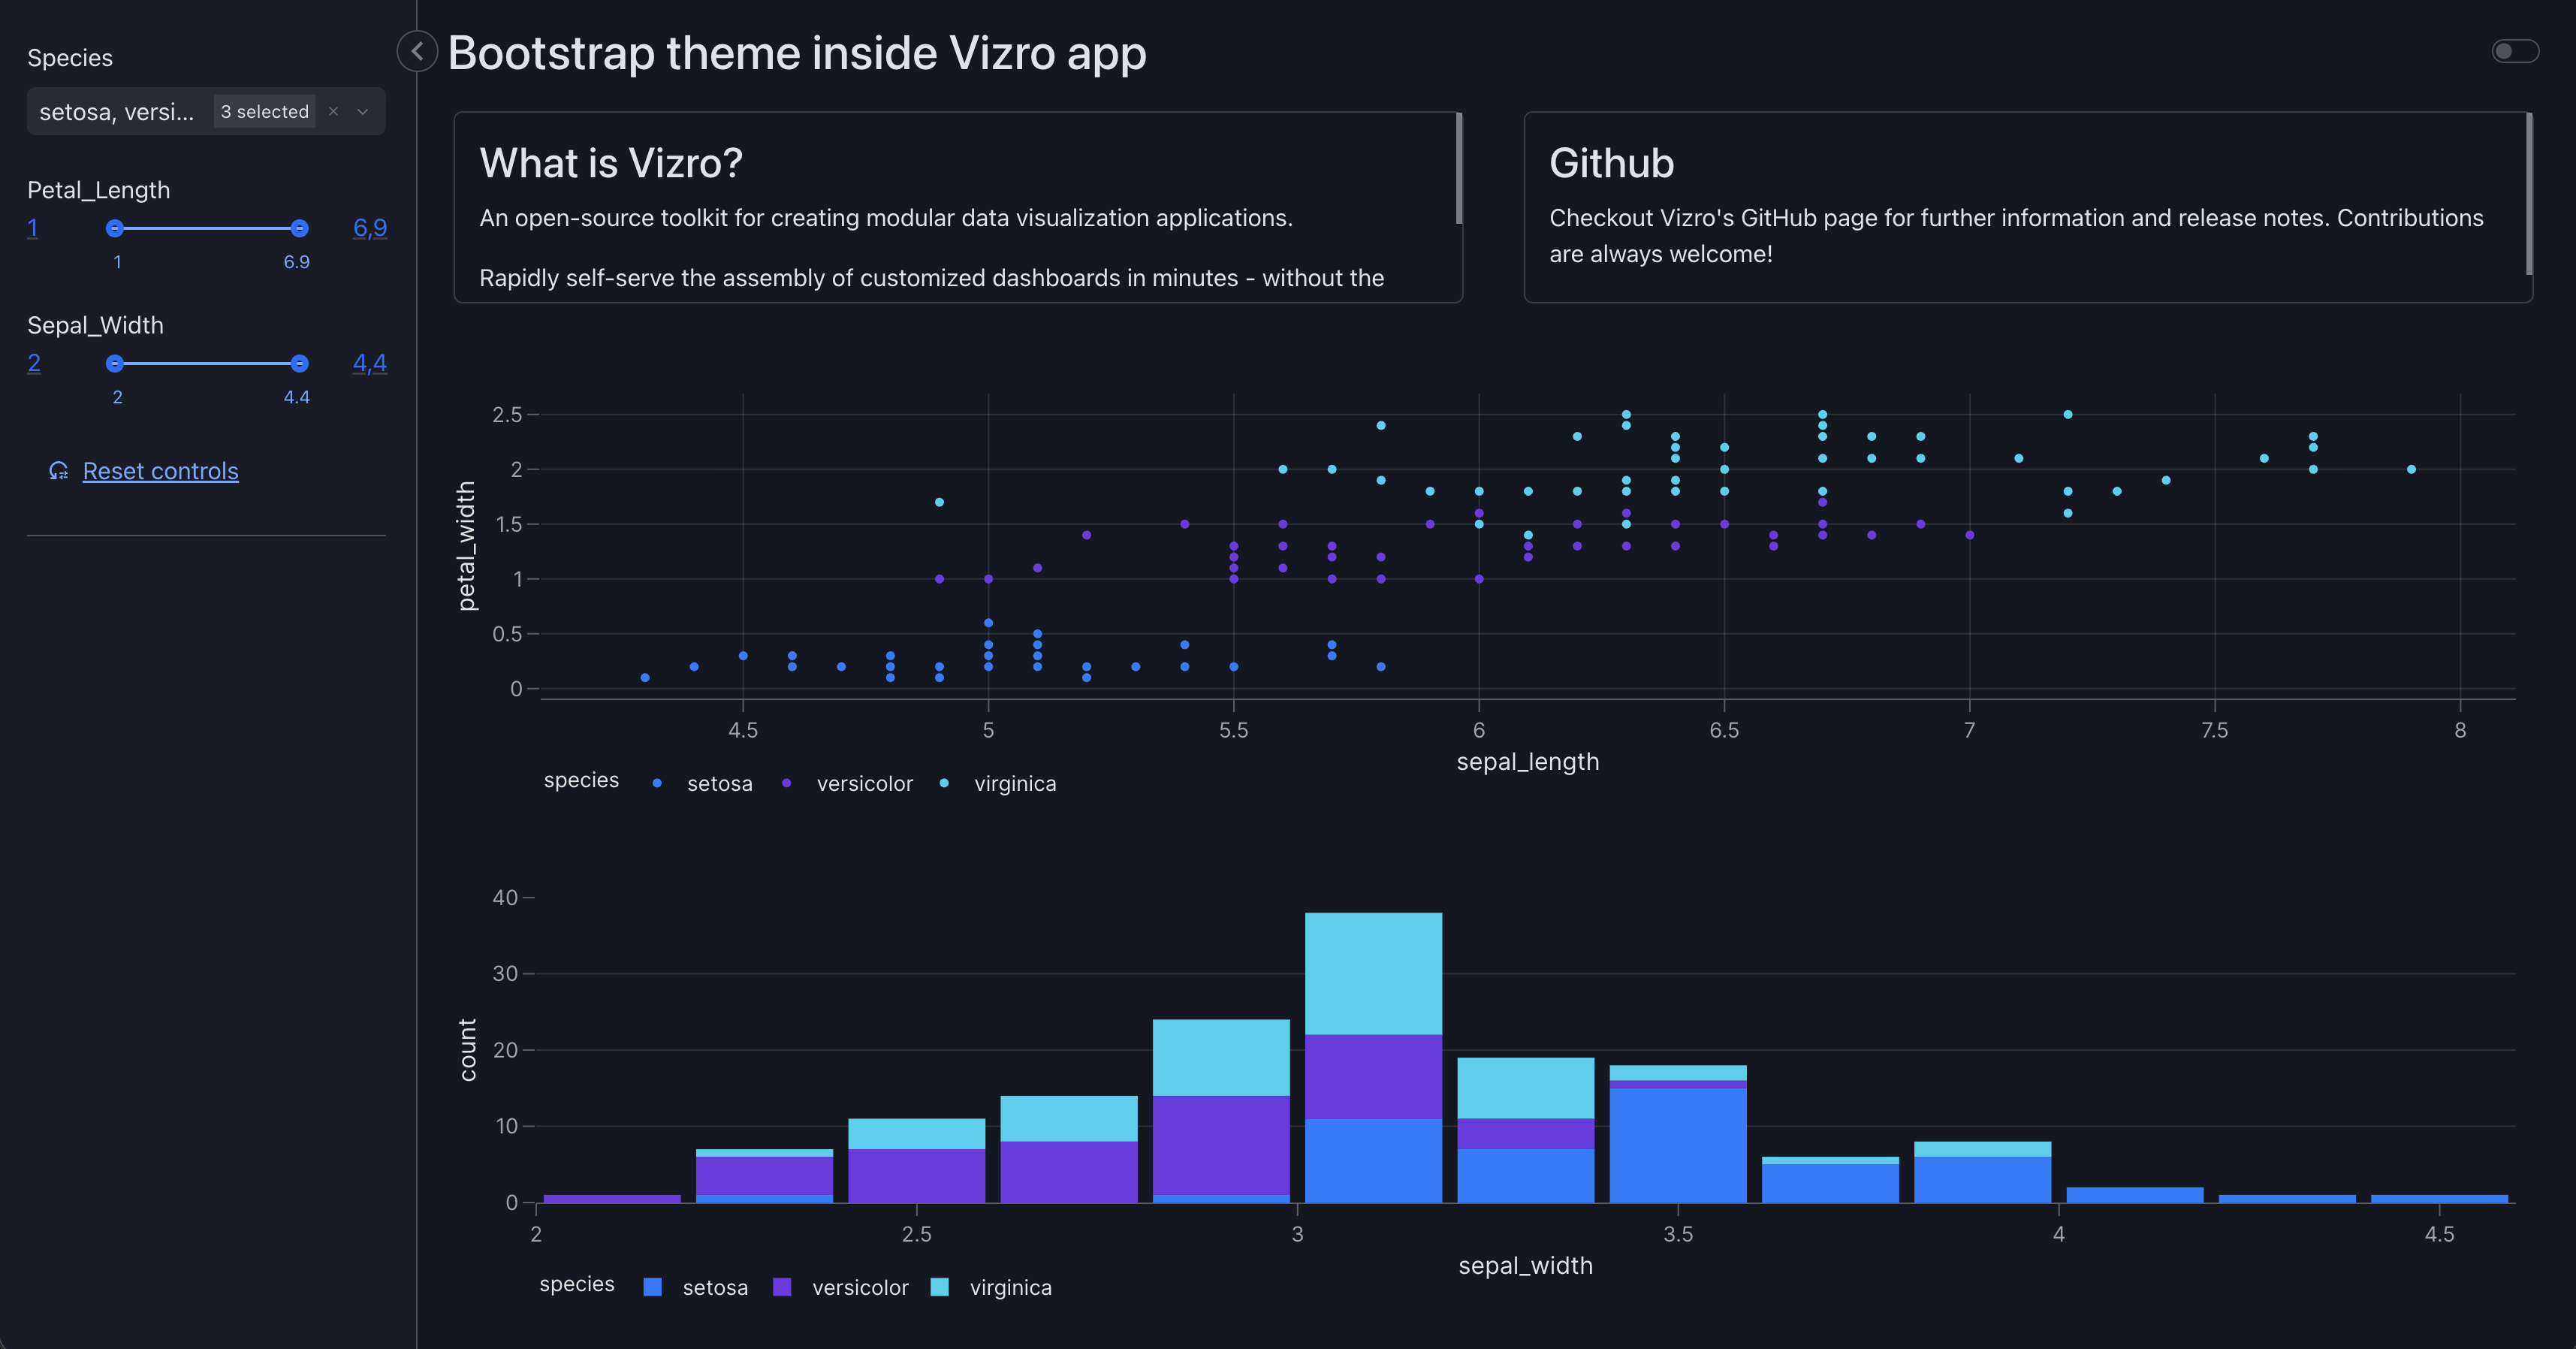
page = vm.Page(
title="Bootstrap theme inside Vizro app",
layout=vm.Grid(grid=[[0, 1], [2, 2], [2, 2], [3, 3], [3, 3]]),
components=[
vm.Card(
text="""
### What is Vizro?
An open-source toolkit for creating modular data visualization applications.
Rapidly self-serve the assembly of customized dashboards in minutes - without the need for advanced coding or design experience - to create flexible and scalable, Python-enabled data visualization applications."""
),
vm.Card(
text="""
### Github
Checkout Vizro's GitHub page for further information and release notes. Contributions are always welcome!""",
href="https://github.com/mckinsey/vizro",
),
vm.Graph(id="scatter_chart", figure=px.scatter(df, x="sepal_length", y="petal_width", color="species")),
vm.Graph(id="hist_chart", figure=px.histogram(df, x="sepal_width", color="species")),
],
controls=[vm.Filter(column="species"), vm.Filter(column="petal_length"), vm.Filter(column="sepal_width")],
)
dashboard = vm.Dashboard(pages=[page])
Vizro(external_stylesheets=[dbc.themes.BOOTSTRAP]).build(dashboard).run()
![]() Run and edit this code in Py.Cafe
Run and edit this code in Py.Cafe
Vizro themes for plotly charts
Vizro registers two new plotly themes, vizro_dark and vizro_light, that are used in a Vizro dashboard. You can modify these themes globally or for individual charts. The themes can also be used outside a Vizro dashboard for standalone charts.
Palettes
Vizro's plotly themes define their own default qualitative and continuous palettes. These are used automatically in a Vizro dashboard or when using the Vizro themes outside a dashboard.
vizro.themes provides direct access to these palettes, alternatives, and the underlying color system. Each color has been carefully selected to ensure visual consistency, professional aesthetics, and accessibility. All our color palettes are colorblind-safe.
The API reference shows all the available palettes, split into three categories:
- Qualitative (
palettes.qualitative): 10 discrete colors for representing categorical data. - Sequential (
palettes.sequential_*): gradual color progressions for ordered or continuous data. - Diverging (
palettes.diverging_*): two-tone color scales designed for data with a meaningful center point.
All the colors that make up the palettes and our color system are available through vizro.themes.colors.
Default palette behavior
Plotly charts automatically apply palettes.qualitative to categorical data and palettes.sequential to continuous numerical data. Override these defaults by explicitly setting color_discrete_sequence or color_continuous_scale parameters in your chart function.
Use Vizro palettes
Modify Vizro plotly themes
You can customize the built-in vizro_dark and vizro_light themes by modifying their properties directly. This is useful when you want to keep most of the Vizro styling but adjust specific elements like colors, fonts, or other visual properties. Vizro templates are automatically registered to plotly.io.templates so you can access and modify them like any other Plotly template.
Modify template color scheme
import plotly.io as pio
import vizro.models as vm
import vizro.plotly.express as px
from vizro import Vizro

# Modify the template's color scheme
pio.templates["vizro_dark"].layout.colorway = [
    "#6929c4",  # Purple
    "#2d9fea",  # Cyan
    "#de6da9",  # Pink
]

df = px.data.iris()

page = vm.Page(
    title="Modified color scheme",
    components=[
        vm.Graph(
            figure=px.histogram(df, x="sepal_width", color="species"),
        ),
    ],
)

dashboard = vm.Dashboard(pages=[page])
Vizro().build(dashboard).run()
![]() Run and edit this code in Py.Cafe
Run and edit this code in Py.Cafe
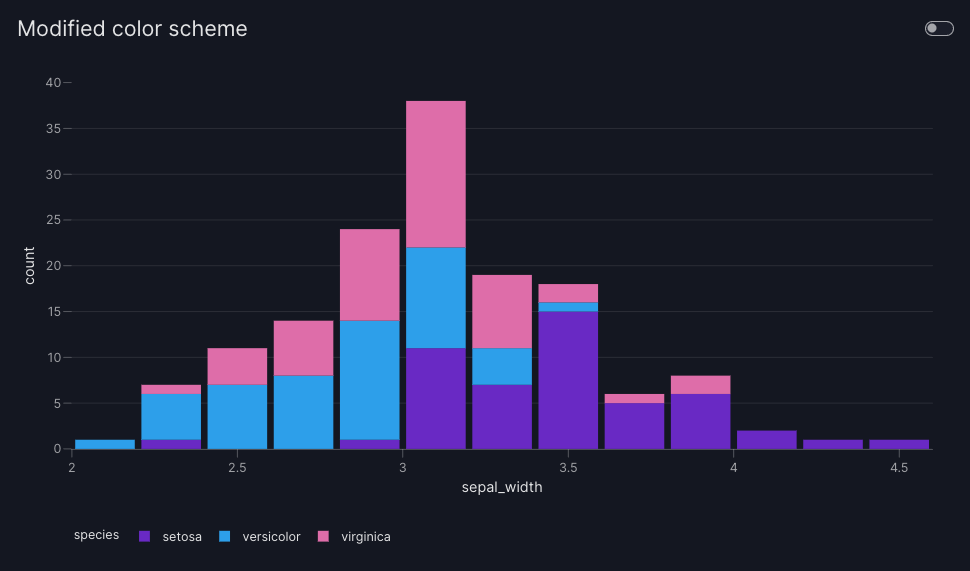
Color scheme applies to both light and dark themes
When you modify the colorway of the vizro_dark template, the change applies to both light and dark theme in a Vizro dashboard. When users toggle between themes, layout properties (backgrounds, fonts) update, but data colors remain the same.
For more comprehensive customizations, you can modify multiple template properties at once using dictionary updates.
Modify multiple template properties
import plotly.io as pio
import vizro.models as vm
import vizro.plotly.express as px
from vizro import Vizro

# Modify multiple properties of vizro_dark using dictionary update
pio.templates["vizro_dark"].layout.update({
    "font": {"family": "Courier New, monospace"},
    "xaxis": {"gridcolor": "yellow", "showgrid": True},
    "yaxis": {"gridcolor": "yellow", "showgrid": True},
    "colorway": ["#6929c4", "#2d9fea", "#de6da9"],
})

df = px.data.iris()

page = vm.Page(
    title="Multiple property modifications",
    components=[
        vm.Graph(
            figure=px.histogram(
                df,
                x="sepal_width",
                color="species",
            ),
        ),
    ],
)

dashboard = vm.Dashboard(pages=[page])
Vizro().build(dashboard).run()
![]() Run and edit this code in Py.Cafe
Run and edit this code in Py.Cafe

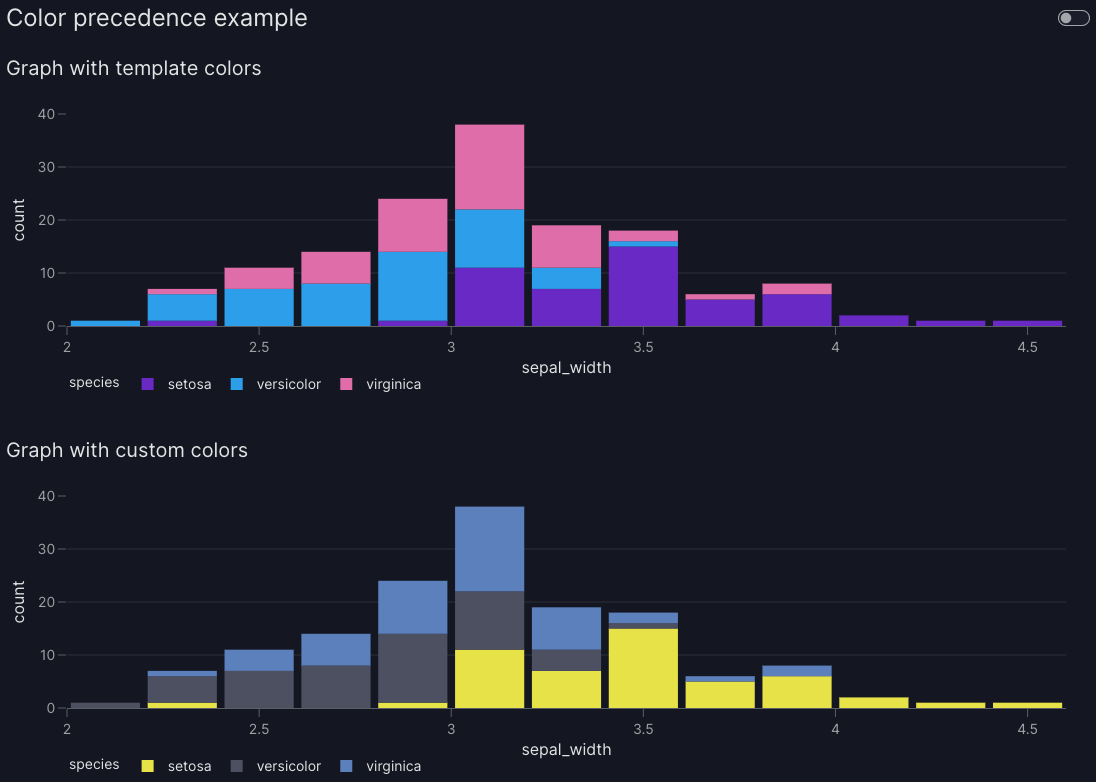
You can achieve fine-grained control over individual charts by using arguments specified directly in chart functions, such as color_discrete_map, color_discrete_sequence, or color_continuous_scale. These always take precedence over template settings.
Template colors vs chart-specific colors
import plotly.io as pio
import vizro.models as vm
import vizro.plotly.express as px
from vizro import Vizro
from vizro.models.types import capture

pio.templates["vizro_dark"].layout.colorway = ["#6929c4", "#2d9fea", "#de6da9"]

df = px.data.iris()

page = vm.Page(
    title="Color precedence example",
    components=[
        vm.Graph(
            figure=px.histogram(
                df,
                x="sepal_width",
                color="species",
            ),
            title="Graph with template colors"
        ),
        vm.Graph(
            figure=px.histogram(
                df,
                x="sepal_width",
                color="species",
                color_discrete_sequence=["#E7E247", "#4D5061", "#5C80BC"]
            ),
            title="Graph with custom colors"
        ),
    ],
)

dashboard = vm.Dashboard(pages=[page])
Vizro().build(dashboard).run()
![]() Run and edit this code in Py.Cafe
Run and edit this code in Py.Cafe
Charts outside a dashboard
You can also use our vizro_dark and vizro_light templates for plotly charts outside the dashboard. This is useful in a few contexts:
- Creation of standalone charts to be used independently of a Vizro dashboard.
- Rapid development of charts for eventual use in a Vizro dashboard, for example in a Jupyter Notebook.
Note
Using import vizro.plotly.express as px is the same as using import plotly.express as px, but with the added benefit of being able to integrate the resulting chart code into a Vizro dashboard. Vizro offers a minimal layer on top of Plotly's existing charting library, allowing you to seamlessly use all the existing charts and functionalities provided by plotly.express without any modifications. Also, by default, plots imported from vizro.plotly.express have the vizro_dark theme applied.
The vizro_dark and vizro_light themes are automatically registered to plotly.io.templates when importing Vizro. To change the theme to vizro_light for all charts, run:
To change the template for a single Plotly Express chart, use the argument template="vizro_light".
Vizro Bootstrap for pure Dash app
Vizro apps use the Dash Bootstrap Components library of Bootstrap components for Dash. If you have a pure Dash app and want to use Vizro's themes, you can apply Vizro's Bootstrap stylesheet in a similar way to other Dash Bootstrap themes through the vizro.bootstrap variable:
Vizro uses some extra CSS in addition to the Bootstrap stylesheet to style some Dash components that are used in Vizro but are not part of Bootstrap (for example, DatePicker is based on Dash Mantine Components). If you would like your pure Dash app to look as close to Vizro as possible then you will also need this extra CSS.
Apply Vizro Bootstrap theme to charts and other components
You can apply the Vizro theme to plotly charts with or without Vizro Bootstrap.
If you want to style your entire Dash app with Vizro Bootstrap and have your plotly figures automatically match then we recommend dash-bootstrap-templates. You can find examples of how to do this in their documentation on styling plotly figures with a Bootstrap theme.