Latest updates
Filter by Time-of-day
The new TimePicker selector lets users filter by time-of-day, either as a single time or as a time range. Use it together with the DatePicker to slice your data by both date and time.
Controls in Containers
The Container has a controls argument where you can define container-specific controls such as filters and parameters. Controls can only target components inside their own container.
Filter by Time-of-day
The new TimePicker selector lets users filter by time-of-day, either as a single time or as a time range. Use it together with the DatePicker to slice your data by both date and time.
New action set_controls
Configure interactions between graphs and tables, as is commonly done in business intelligence (BI) tools.
Notifications
The show_notification action displays a temporary message to the user.
Notifications appear at the top-right of the screen and are customizable with options
for content and styling.
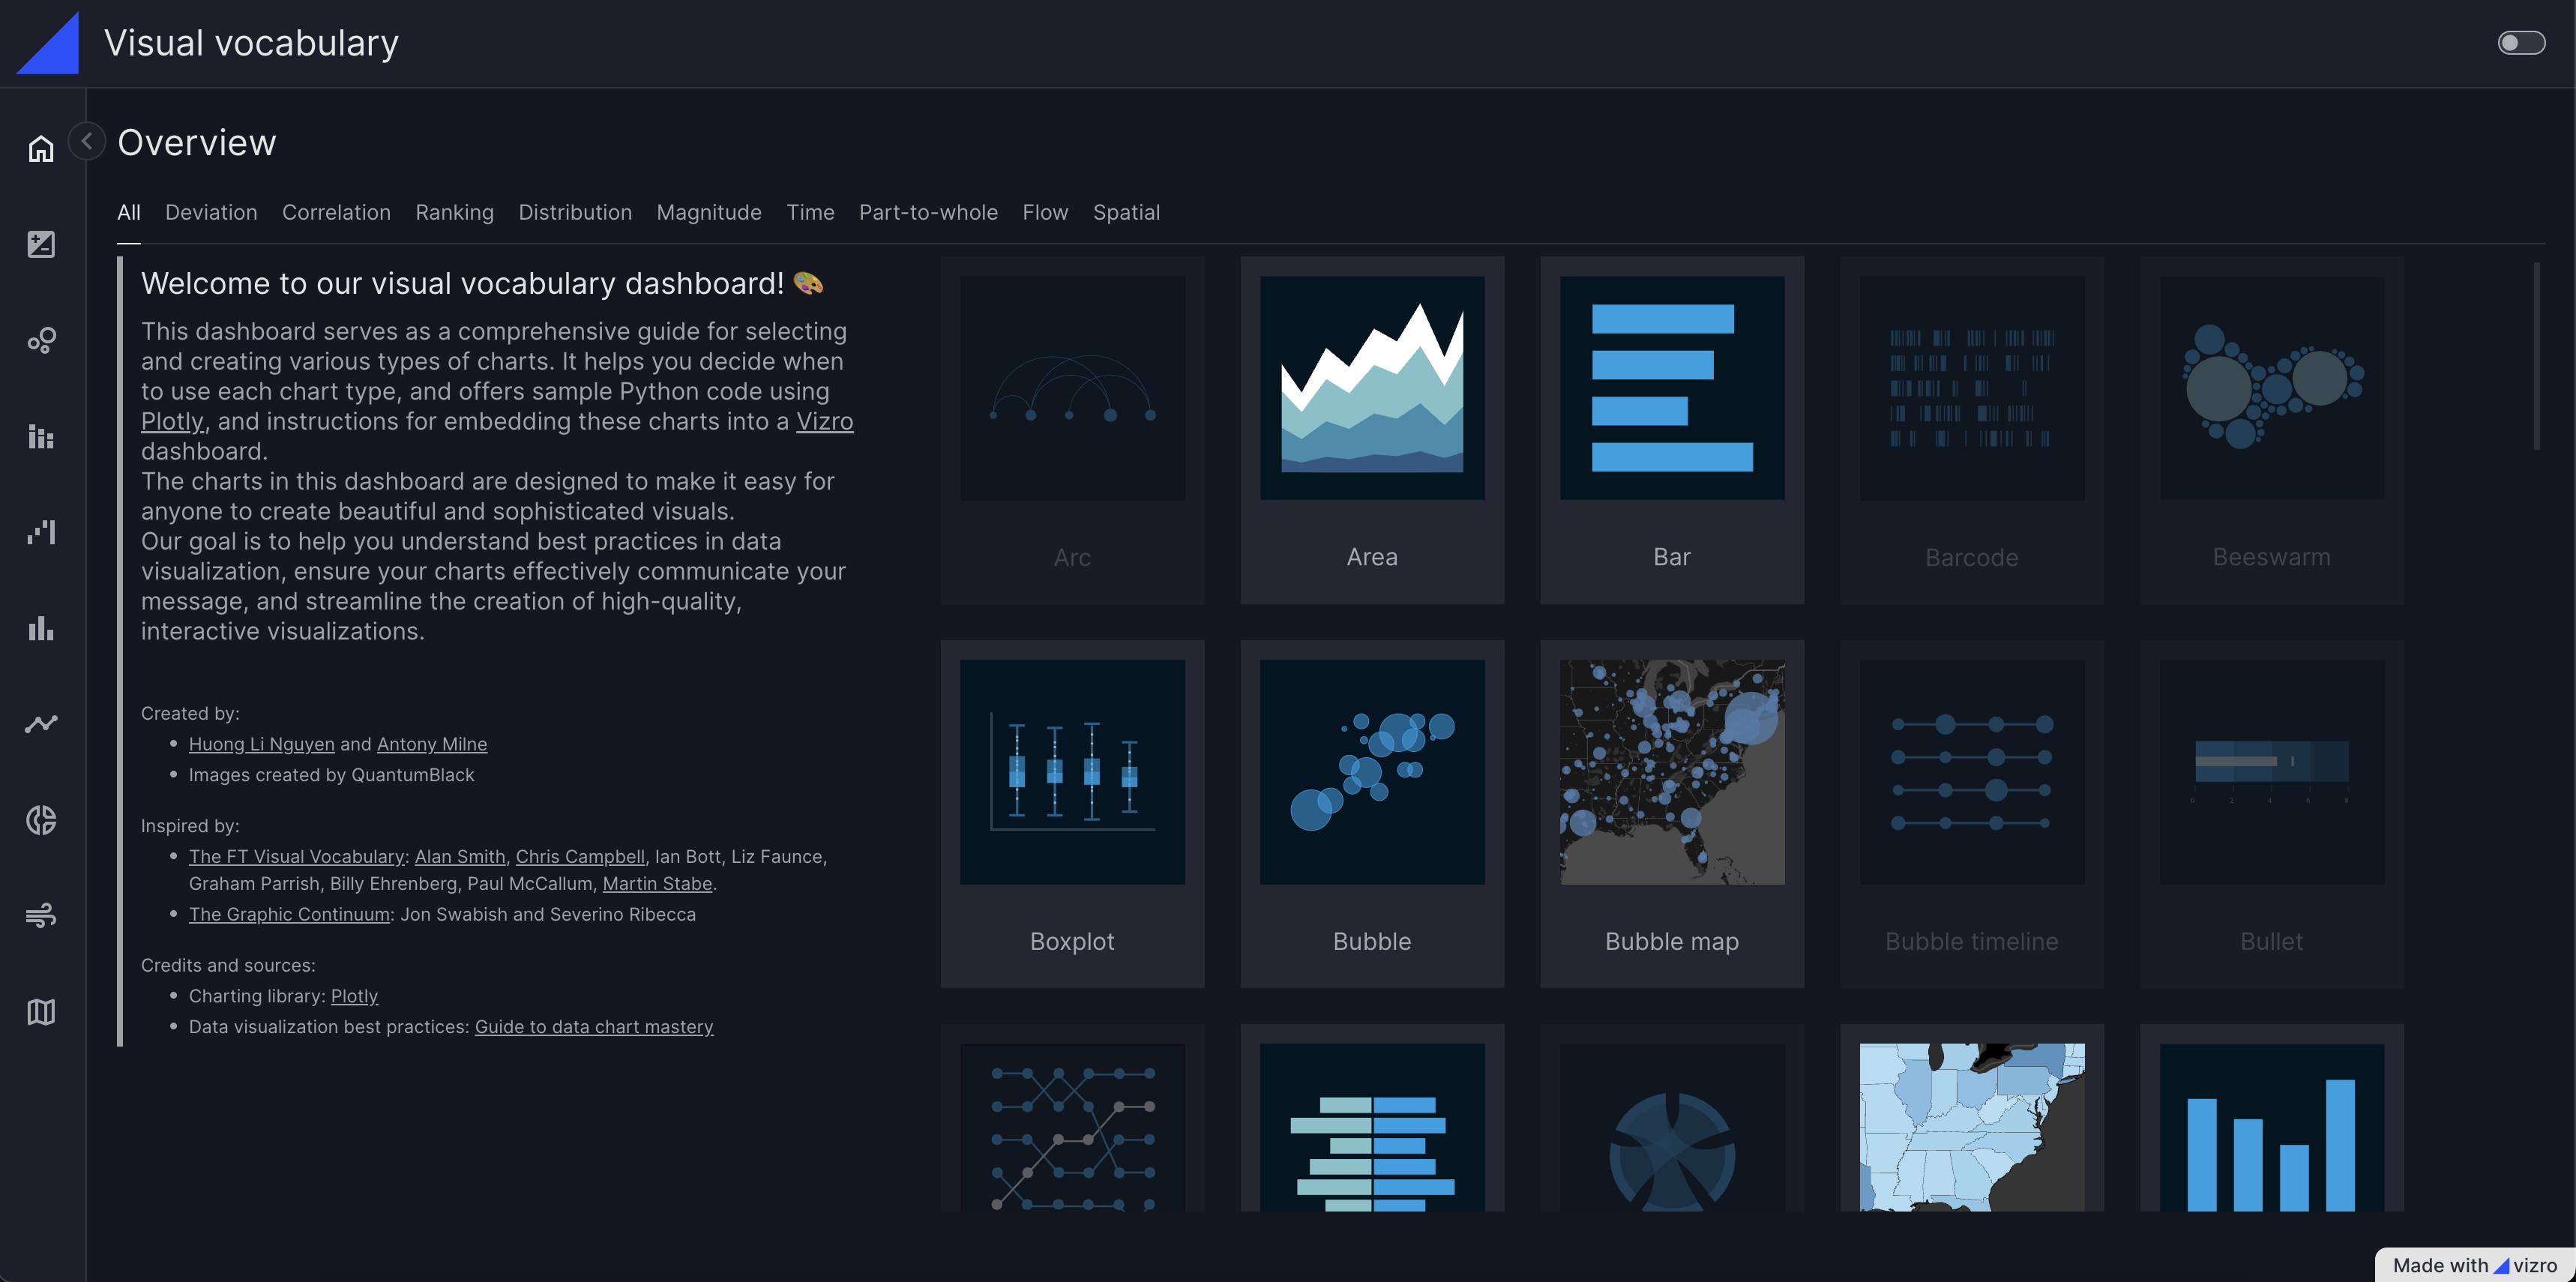
Vizro components
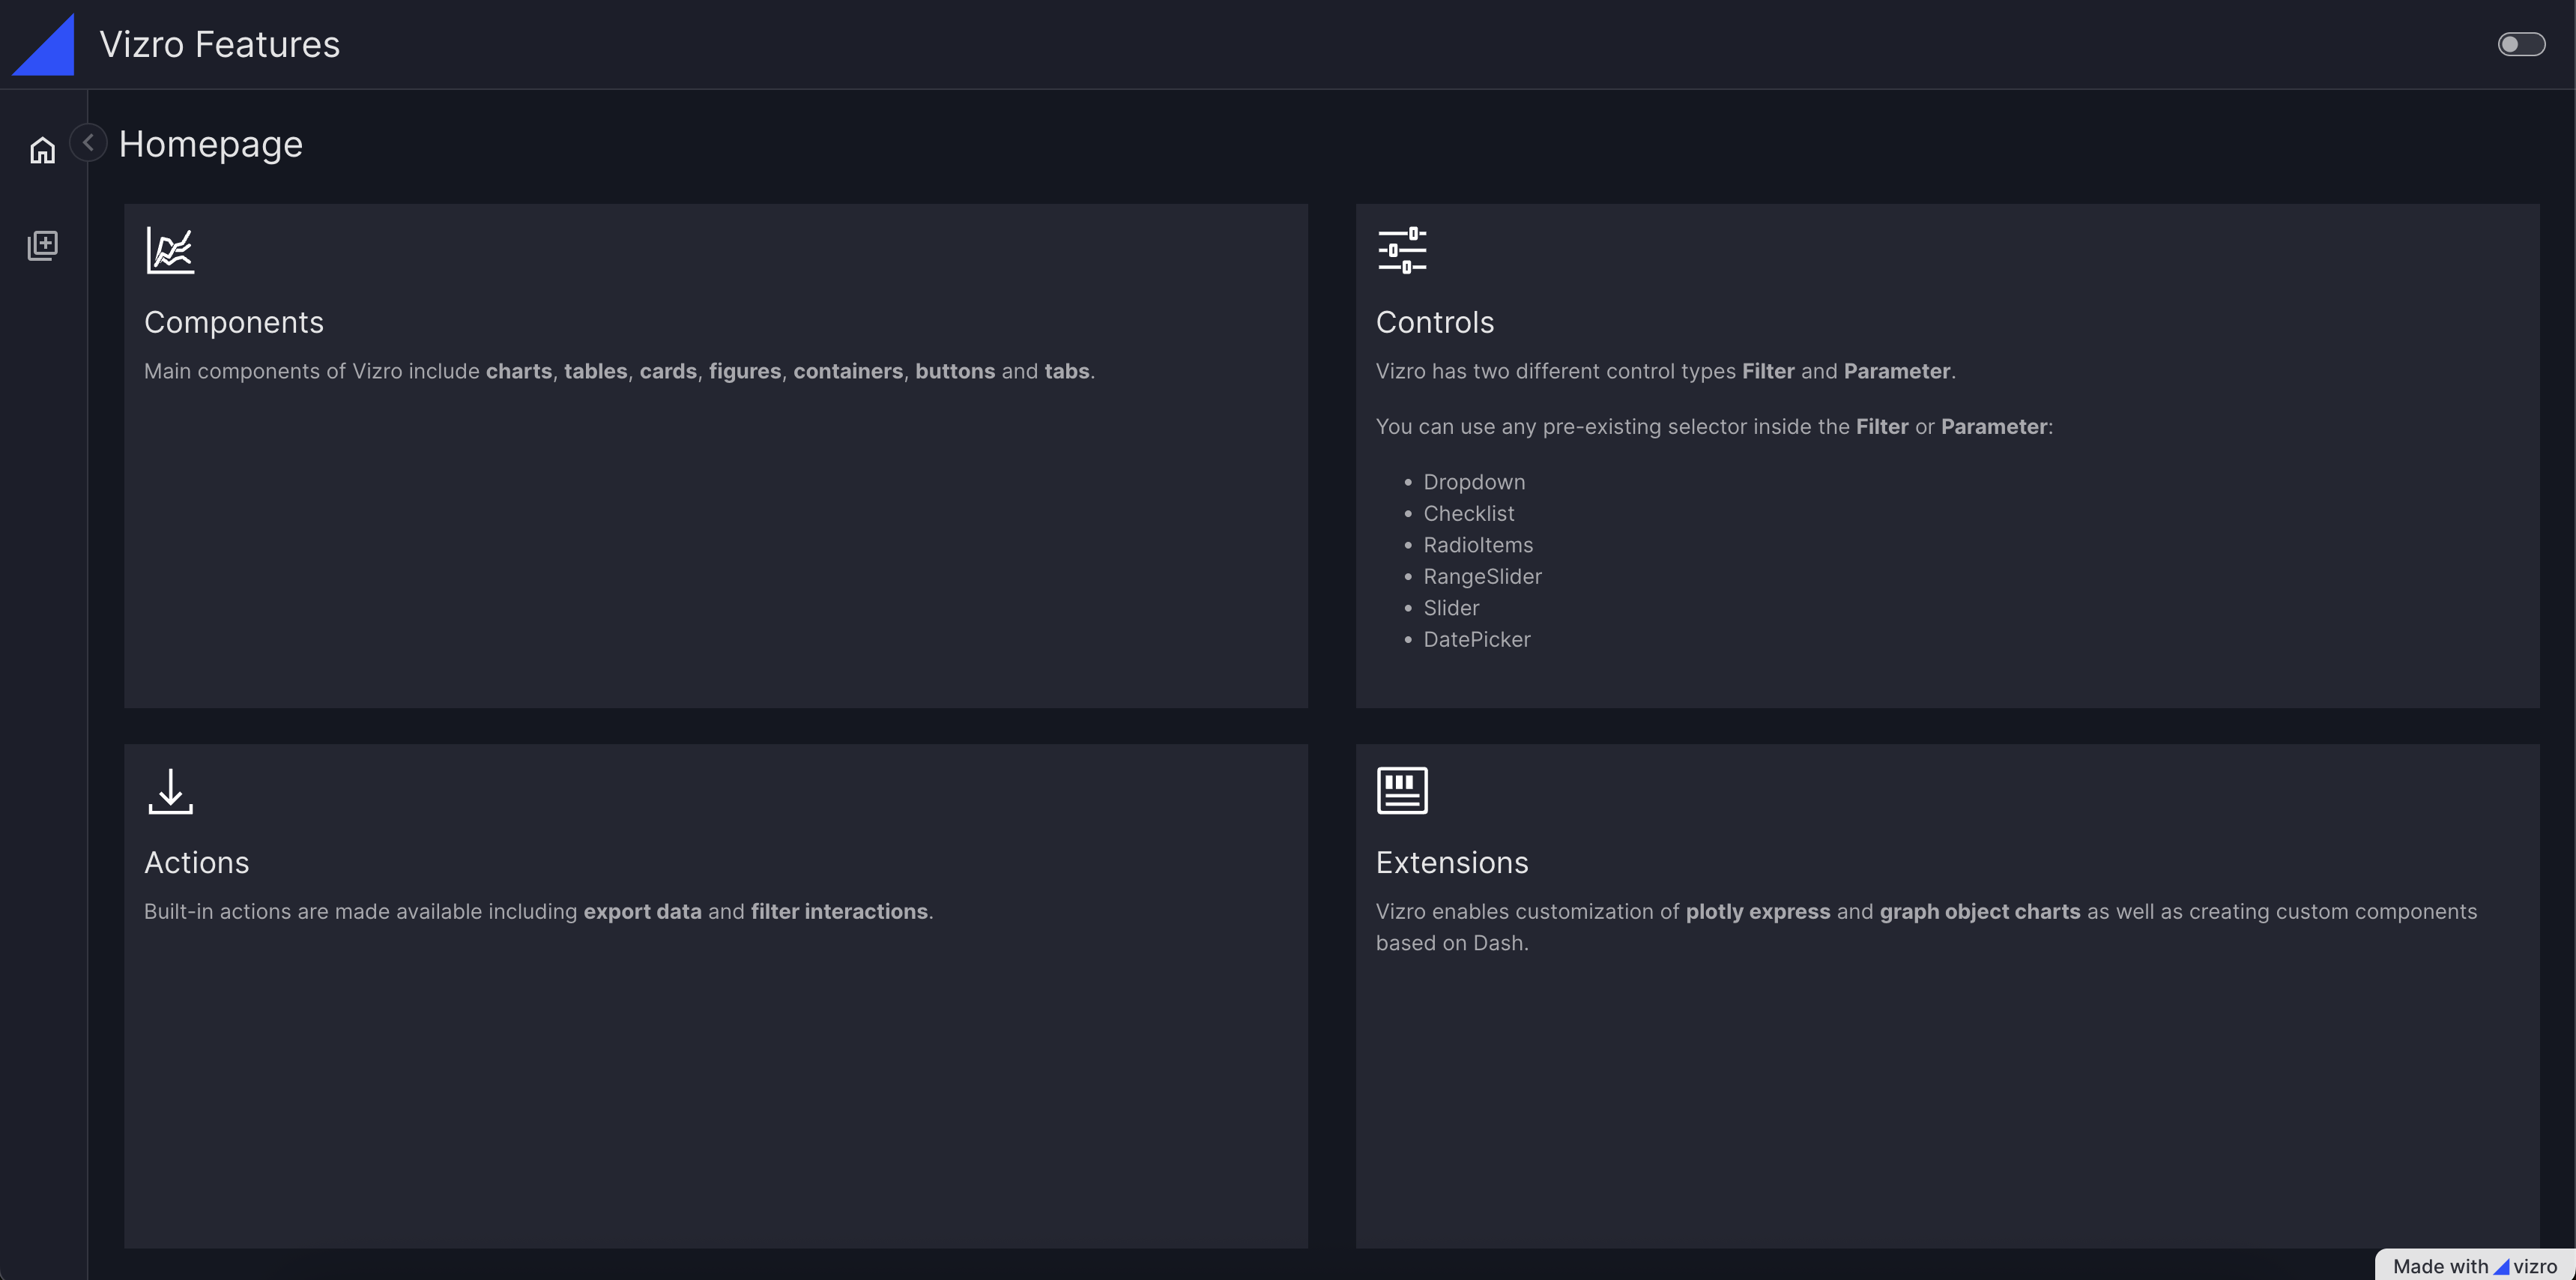
Components
Graph
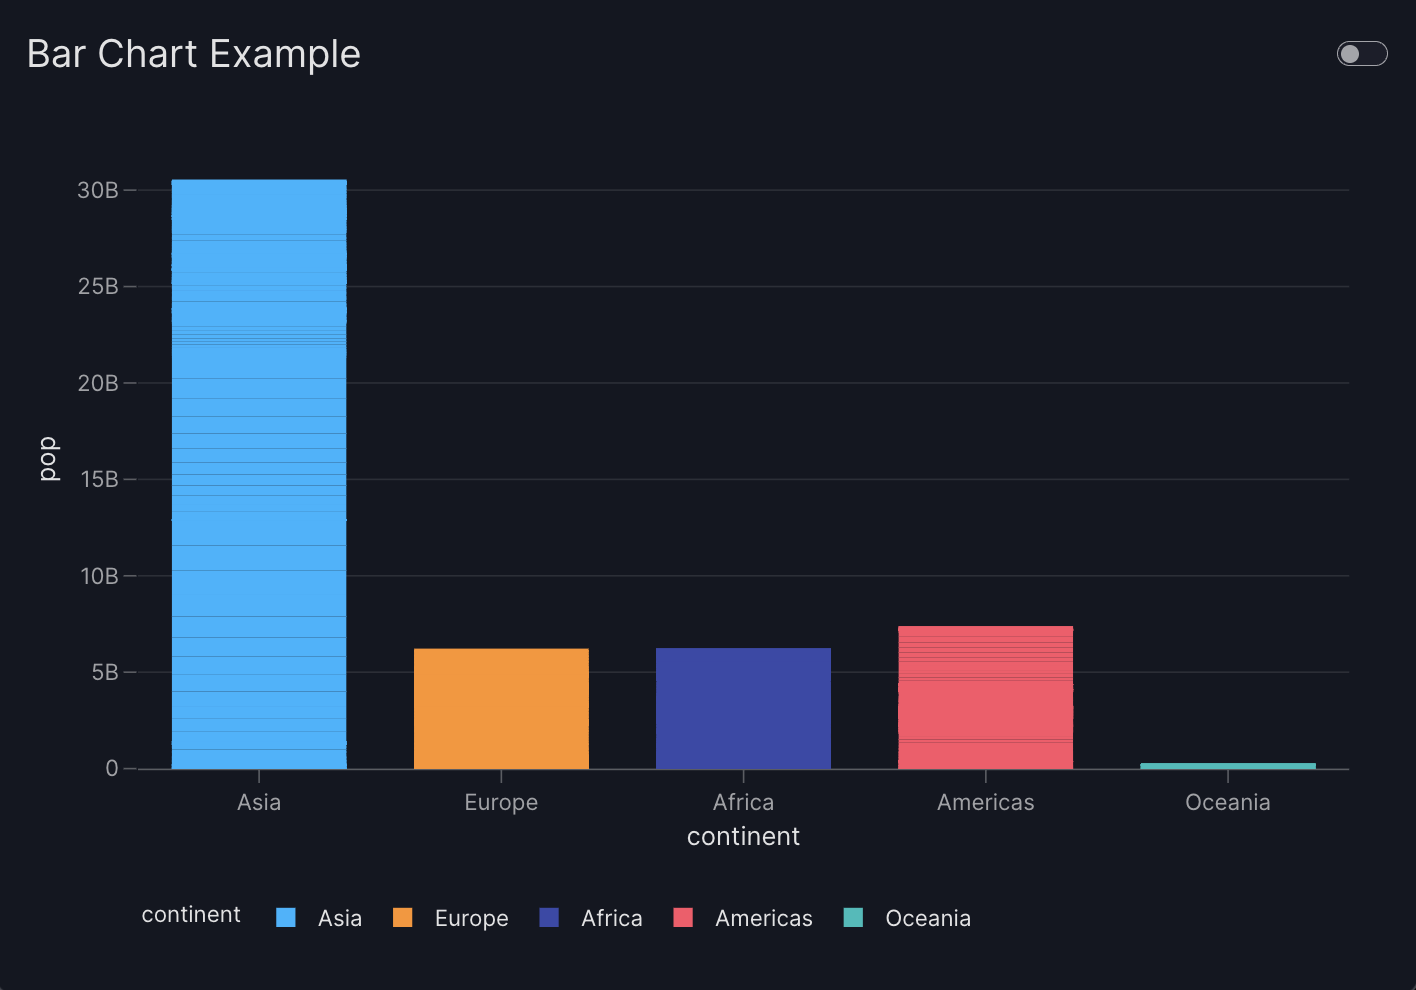
import vizro.plotly.express as px
from vizro import Vizro
import vizro.models as vm

df = px.data.gapminder()

page = vm.Page(
    title="Bar Chart Example",
    components=[
        vm.Graph(
            figure=px.bar(
                df,
                x="continent",
                y="pop",
                color="continent"
            )
        )
    ]
)

Vizro().build(vm.Dashboard(pages=[page])).run()
Card
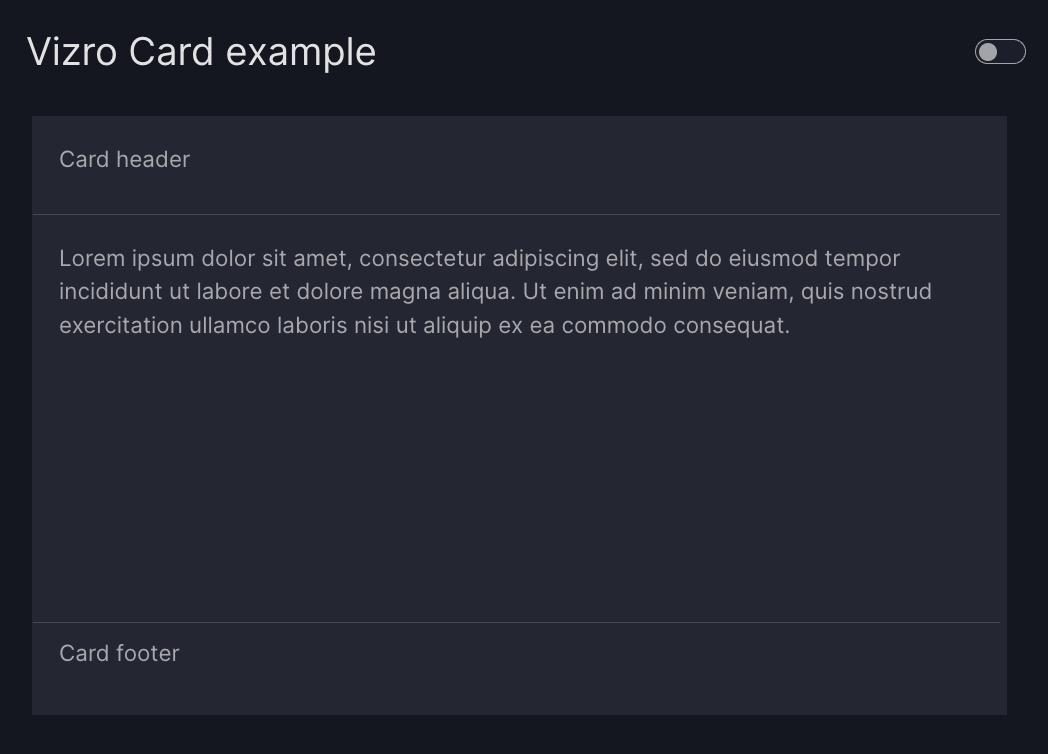
from vizro import Vizro
import vizro.models as vm

page = vm.Page(
    title="Vizro Card example",
    components=[
        vm.Card(
            text="""Lorem ipsum dolor sit amet,
             consectetur adipiscing elit, sed do
             eiusmod tempor incididunt ut labore
             et dolore magna aliqua.""",
            header="Card header",
            footer="Card footer",
        )
    ]
)

Vizro().build(vm.Dashboard(pages=[page])).run()
AgGrid
import vizro.plotly.express as px
import vizro.models as vm
from vizro import Vizro
from vizro.tables import dash_ag_grid
df = px.data.gapminder()
page = vm.Page(
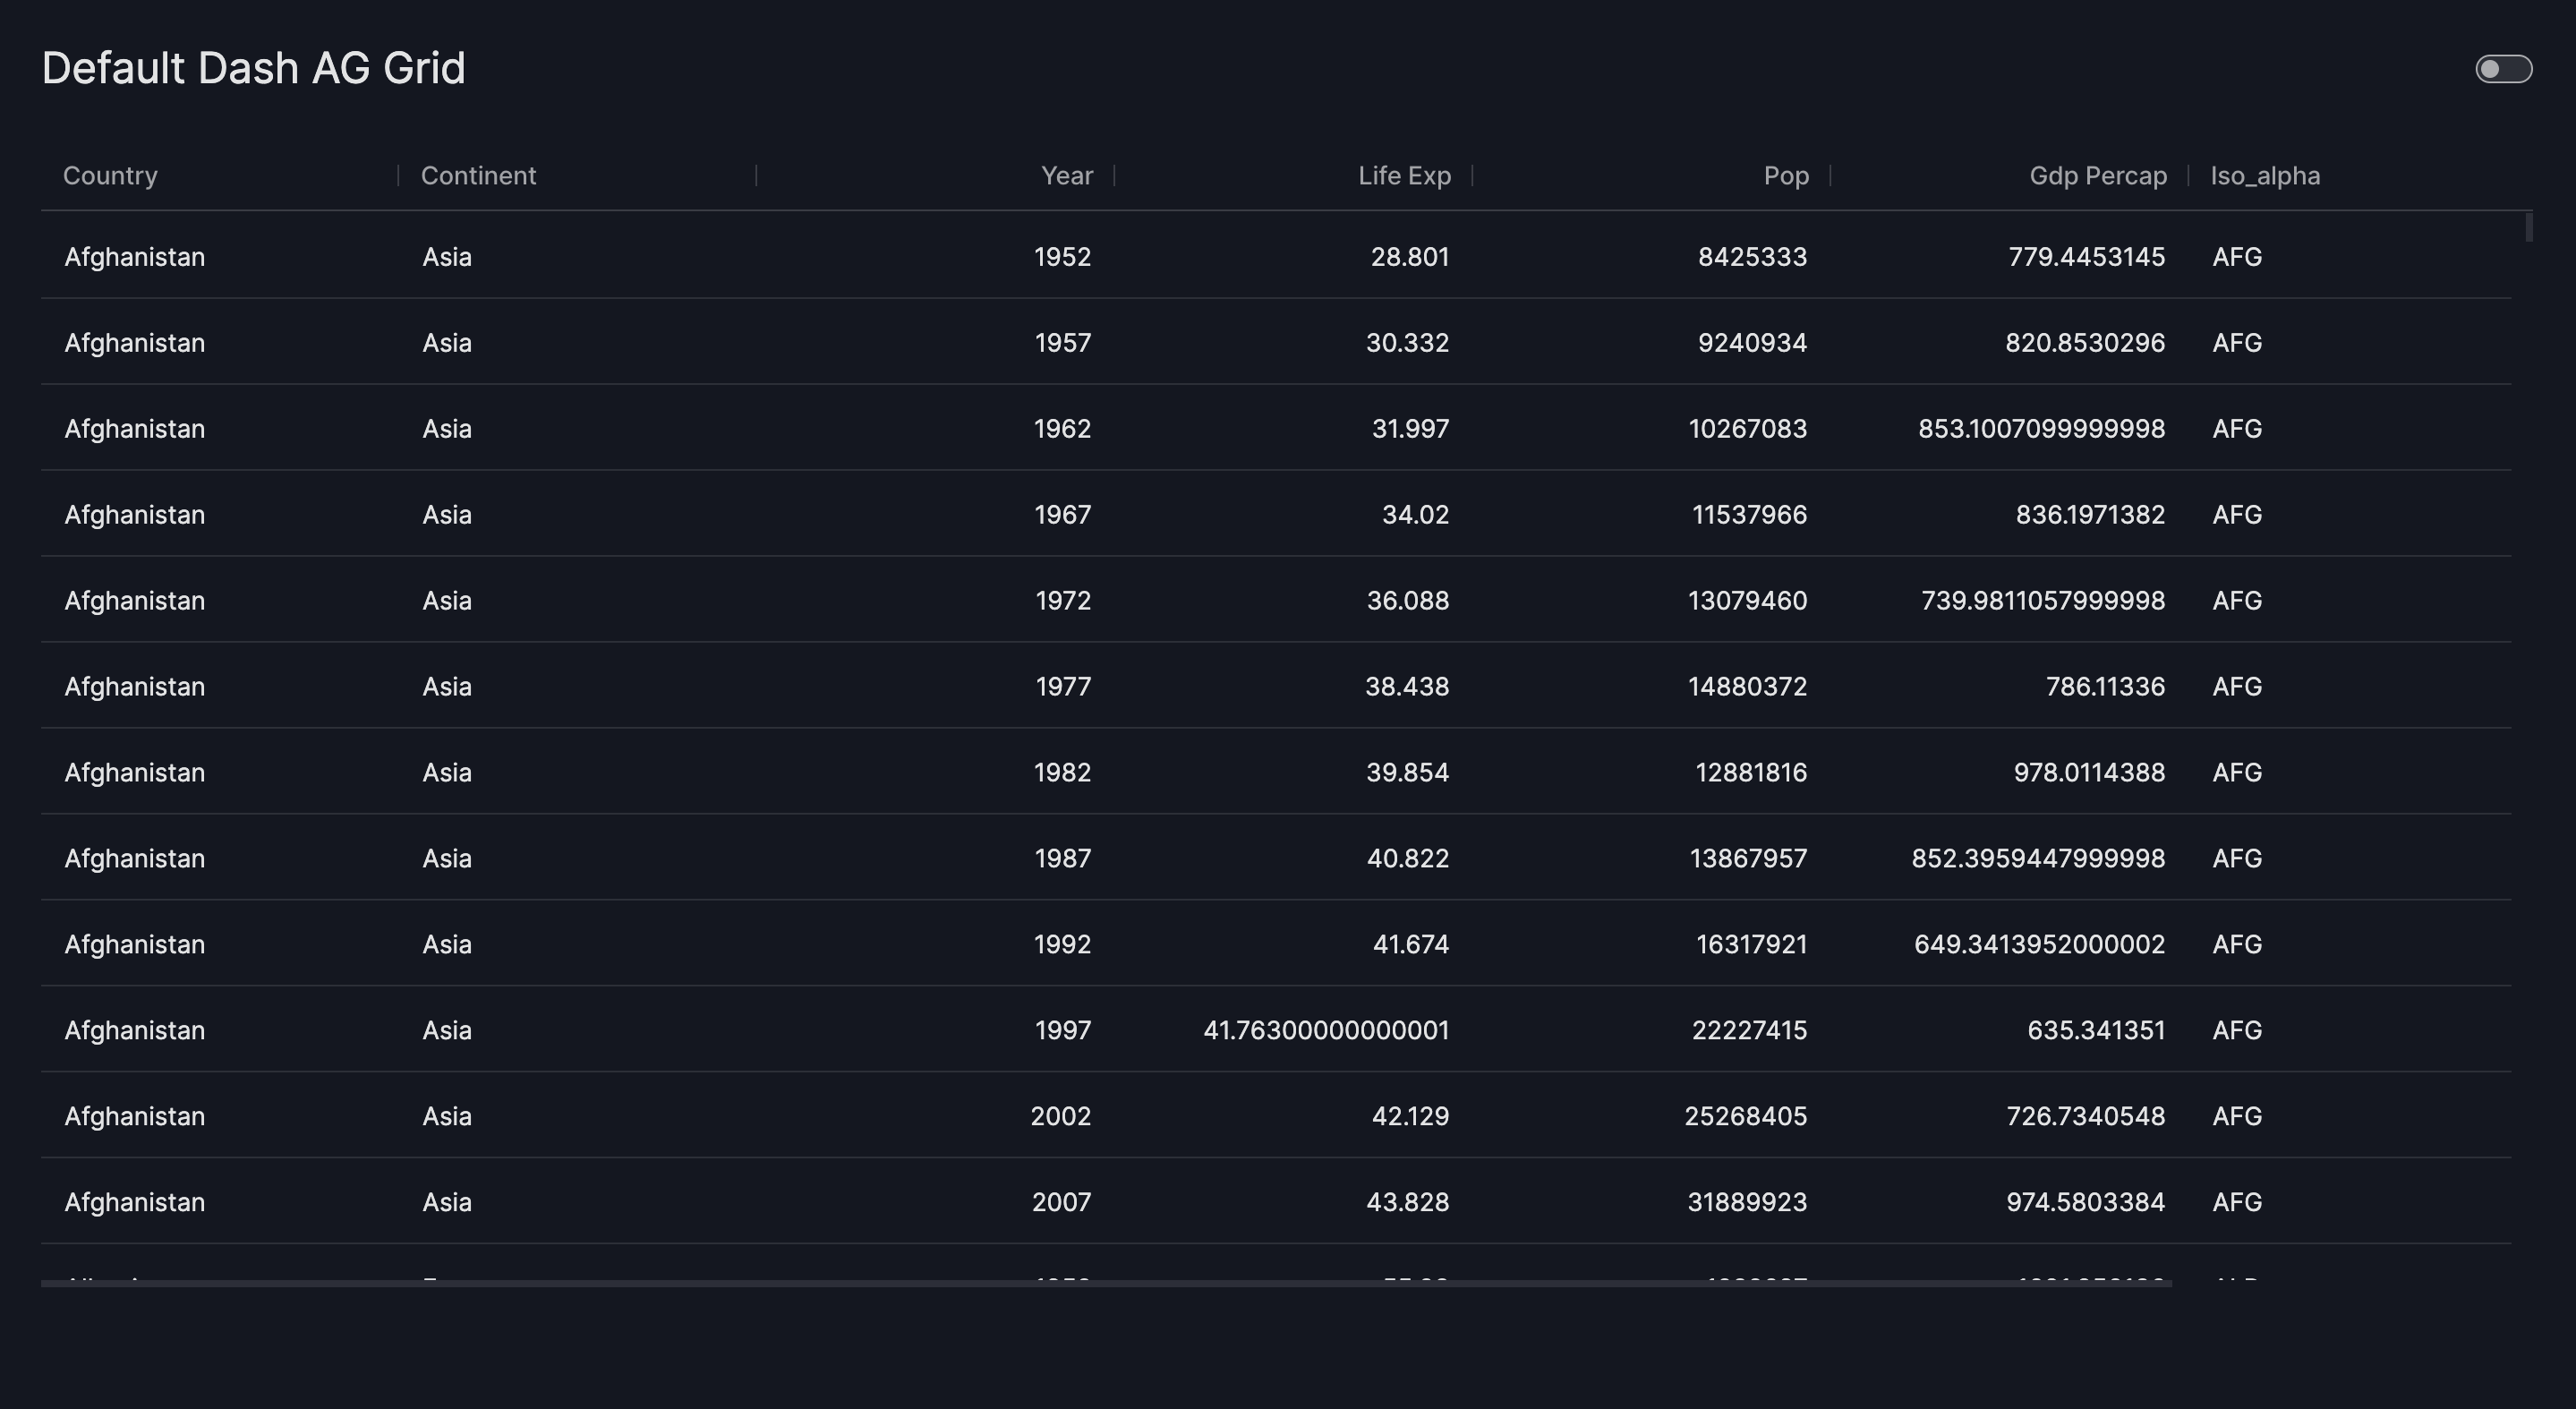
title="Default Dash AG Grid",
components=[
vm.AgGrid(
figure=dash_ag_grid(data_frame=df)
)
]
)
Vizro().build(vm.Dashboard(pages=[page])).run()Button
from vizro import Vizro
import vizro.models as vm
page = vm.Page(
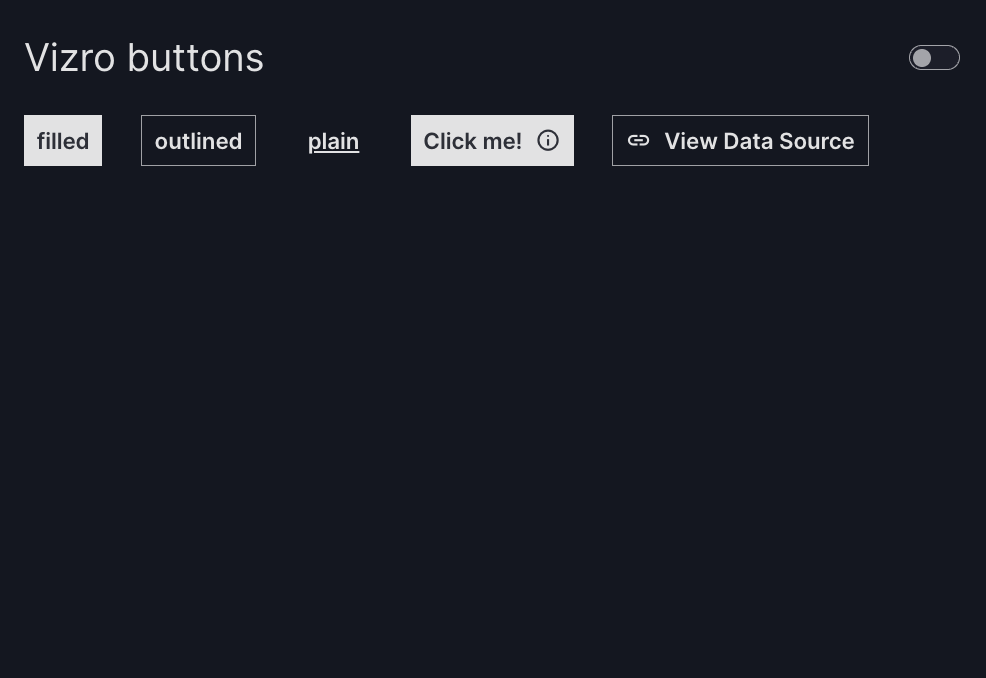
title="Vizro buttons",
layout=vm.Flex(direction="row"),
components=[
vm.Button(
text="filled"
),
vm.Button(
text="outlined",
variant="outlined"
),
vm.Button(
text="plain",
variant="plain"
),
vm.Button(
text="Click me!",
description="Start the process.",
),
vm.Button(
text="Visit Google",
href="https://www.google.com",
icon="Link",
variant="outlined",
),
],
)
Vizro().build(vm.Dashboard(pages=[page])).run()Figure
import pandas as pd
from vizro import Vizro
import vizro.models as vm
from vizro.figures import kpi_card_reference
df_kpi = pd.DataFrame(
{
"Actual": [100, 200, 700],
"Reference": [100, 300, 500],
"Category": ["A", "B", "C"]
}
)
page = vm.Page(
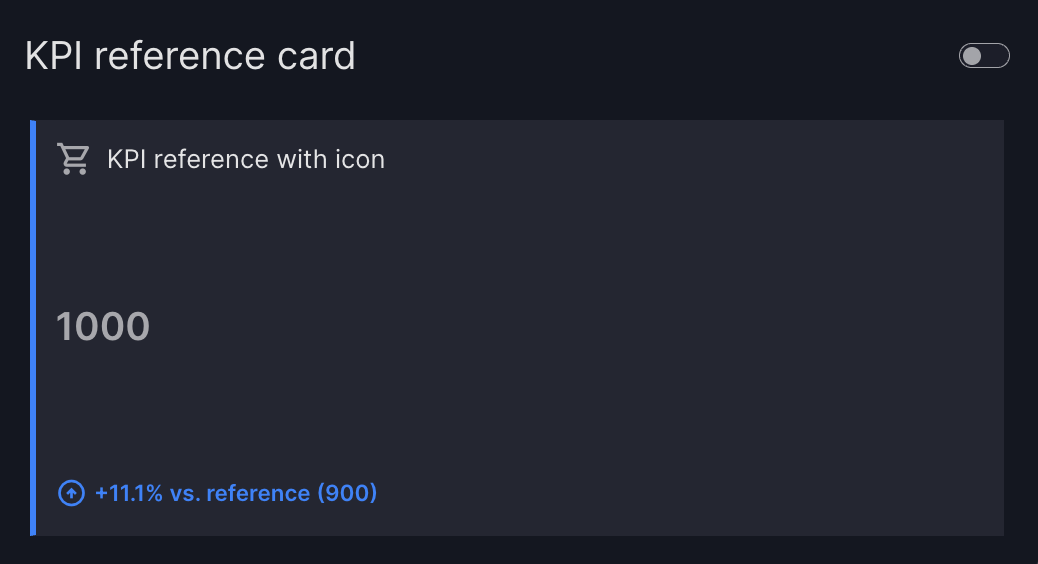
title="KPI reference card",
components=[
vm.Figure(
figure=kpi_card_reference(
data_frame=df_kpi,
value_column="Actual",
reference_column="Reference",
title="KPI reference with icon",
icon="Shopping Cart",
)
)
],
)
Vizro().build(vm.Dashboard(pages=[page])).run()Text

import vizro.plotly.express as px
from vizro import Vizro
import vizro.models as vm

page = vm.Page(
    title="Text",
    components=[
        vm.Text(
            text="""
                ## Lorem ipsum
                Neque porro quisquam est qui
                dolorem ipsum quia dolor sit
                amet, consectetur adipisci.
            """,
        )
    ],
)

Vizro().build(vm.Dashboard(pages=[page])).run()
Container
import vizro.plotly.express as px
import vizro.models as vm
from vizro import Vizro
iris = px.data.iris()
page = vm.Page(
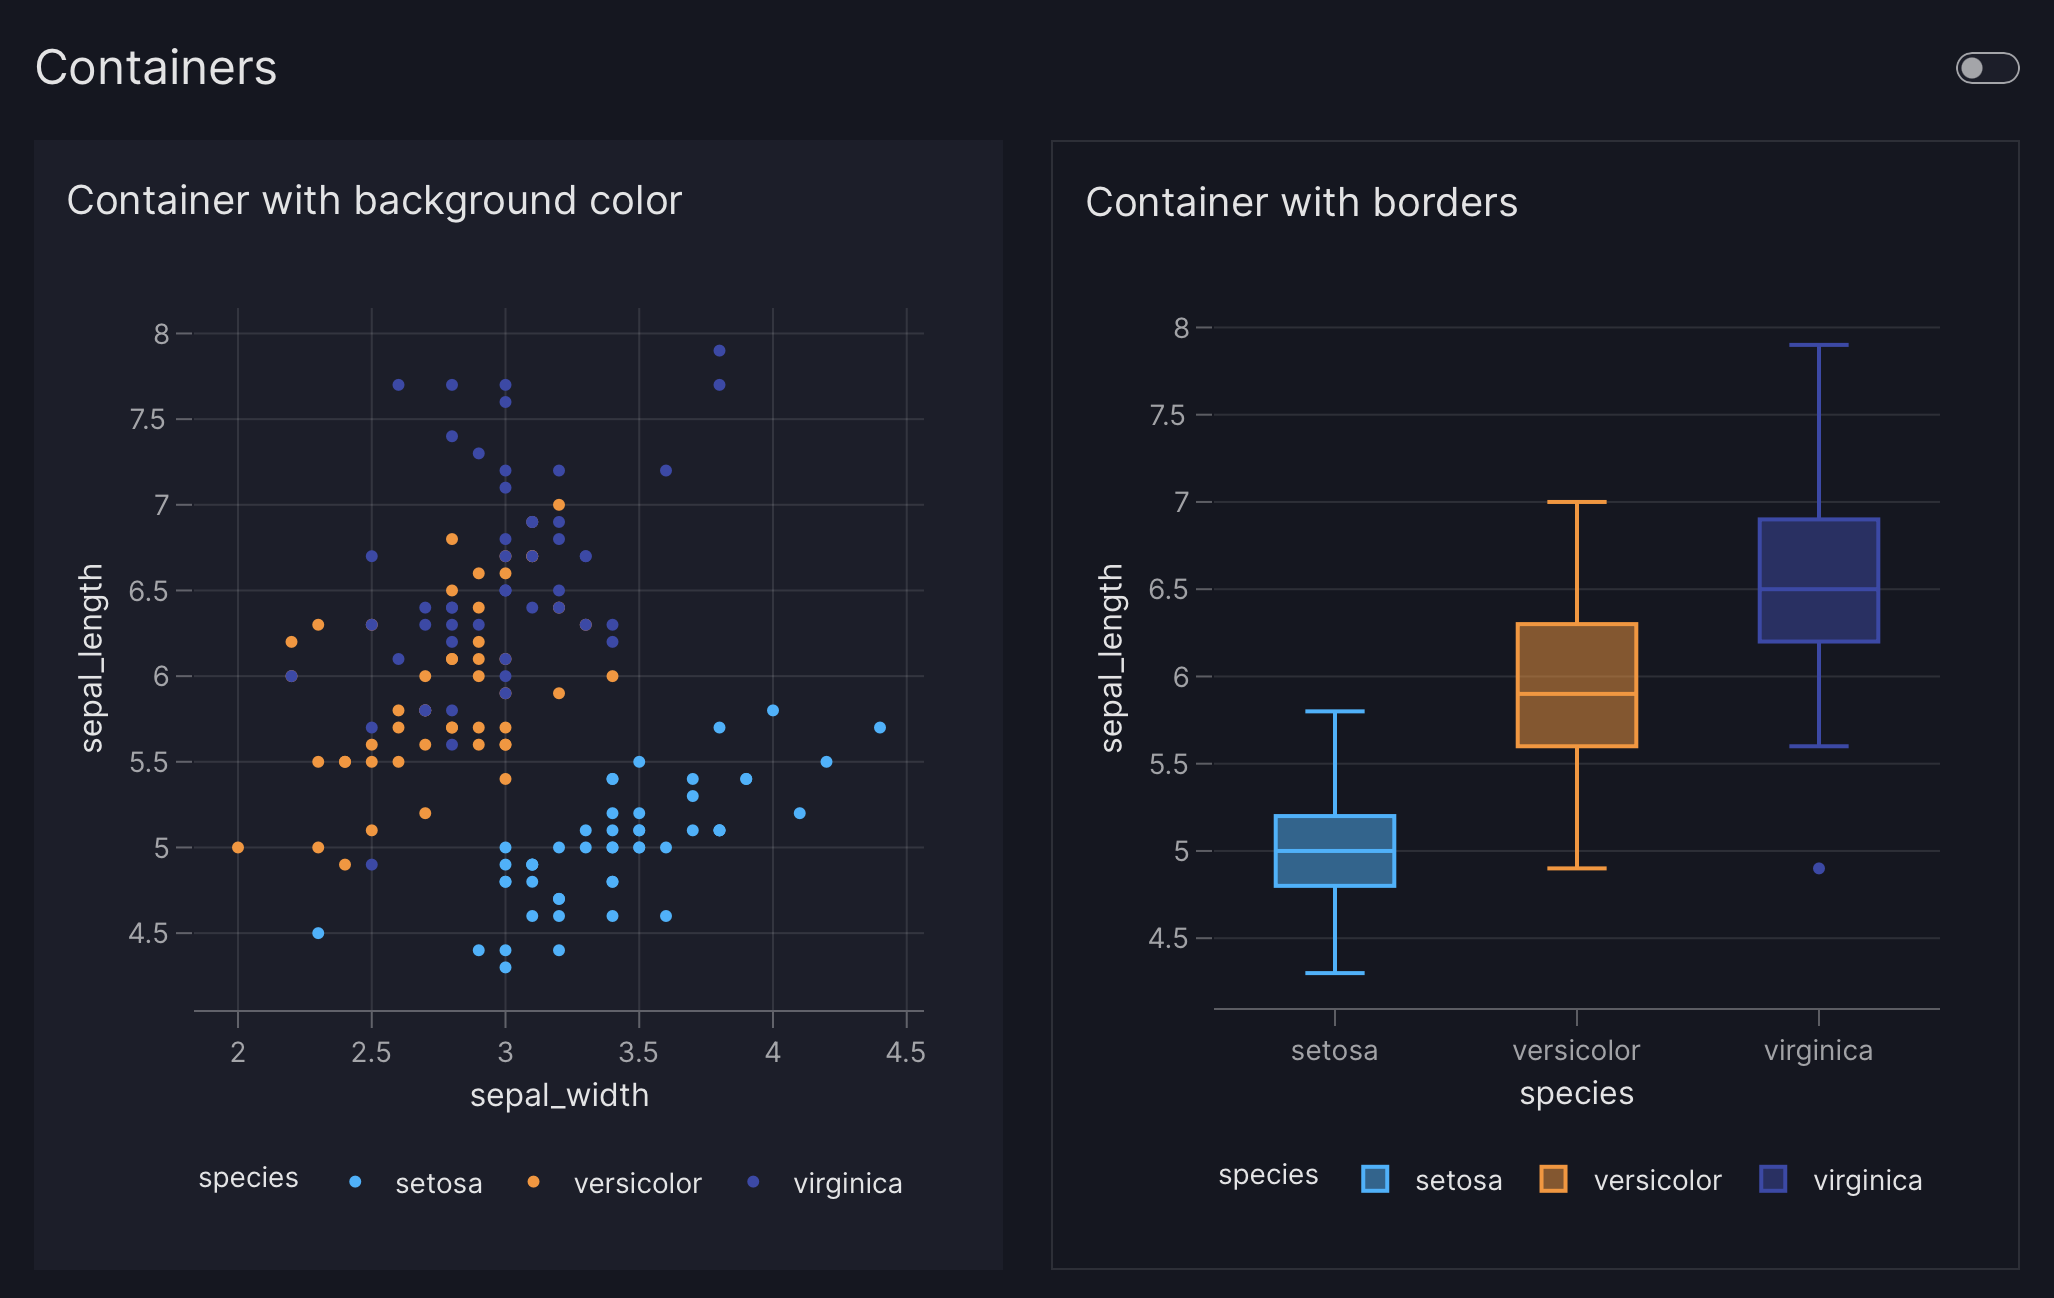
title="Containers",
layout=vm.Grid(grid=[[0, 1]]),
components=[
vm.Container(
title="Container with background color",
components=[
vm.Graph(
figure=px.scatter(
iris,
x="sepal_width",
y="sepal_length",
color="species"
)
)
],
variant="filled",
),
vm.Container(
title="Container with borders",
components=[
vm.Graph(
figure=px.box(
iris,
x="species",
y="sepal_length",
color="species"
)
)
],
variant="outlined",
)
],
)
Vizro().build(vm.Dashboard(pages=[page])).run()Tabs
import vizro.plotly.express as px
from vizro import Vizro
import vizro.models as vm

gapminder = px.data.gapminder()

page = vm.Page(
    title="Tabs",
    components=[
        vm.Tabs(
            title="Tabs Title",
            tabs=[
                vm.Container(
                    title="Tab I",
                    components=[
                        vm.Graph(
                            figure=px.bar(
                                gapminder,
                                title="Graph 1",
                                x="continent",
                                y="lifeExp",
                                color="continent",
                            ),
                        ),
                    ],
                ),
                vm.Container(
                    title="Tab II",
                    components=[
                        vm.Graph(
                            figure=px.scatter(
                                gapminder,
                                title="Graph 3",
                                x="gdpPercap",
                                y="lifeExp",
                                size="pop",
                                color="continent",
                            ),
                        ),
                    ],
                ),
            ],
        ),
    ],
)

Vizro().build(vm.Dashboard(pages=[page])).run()
Layout
Grid
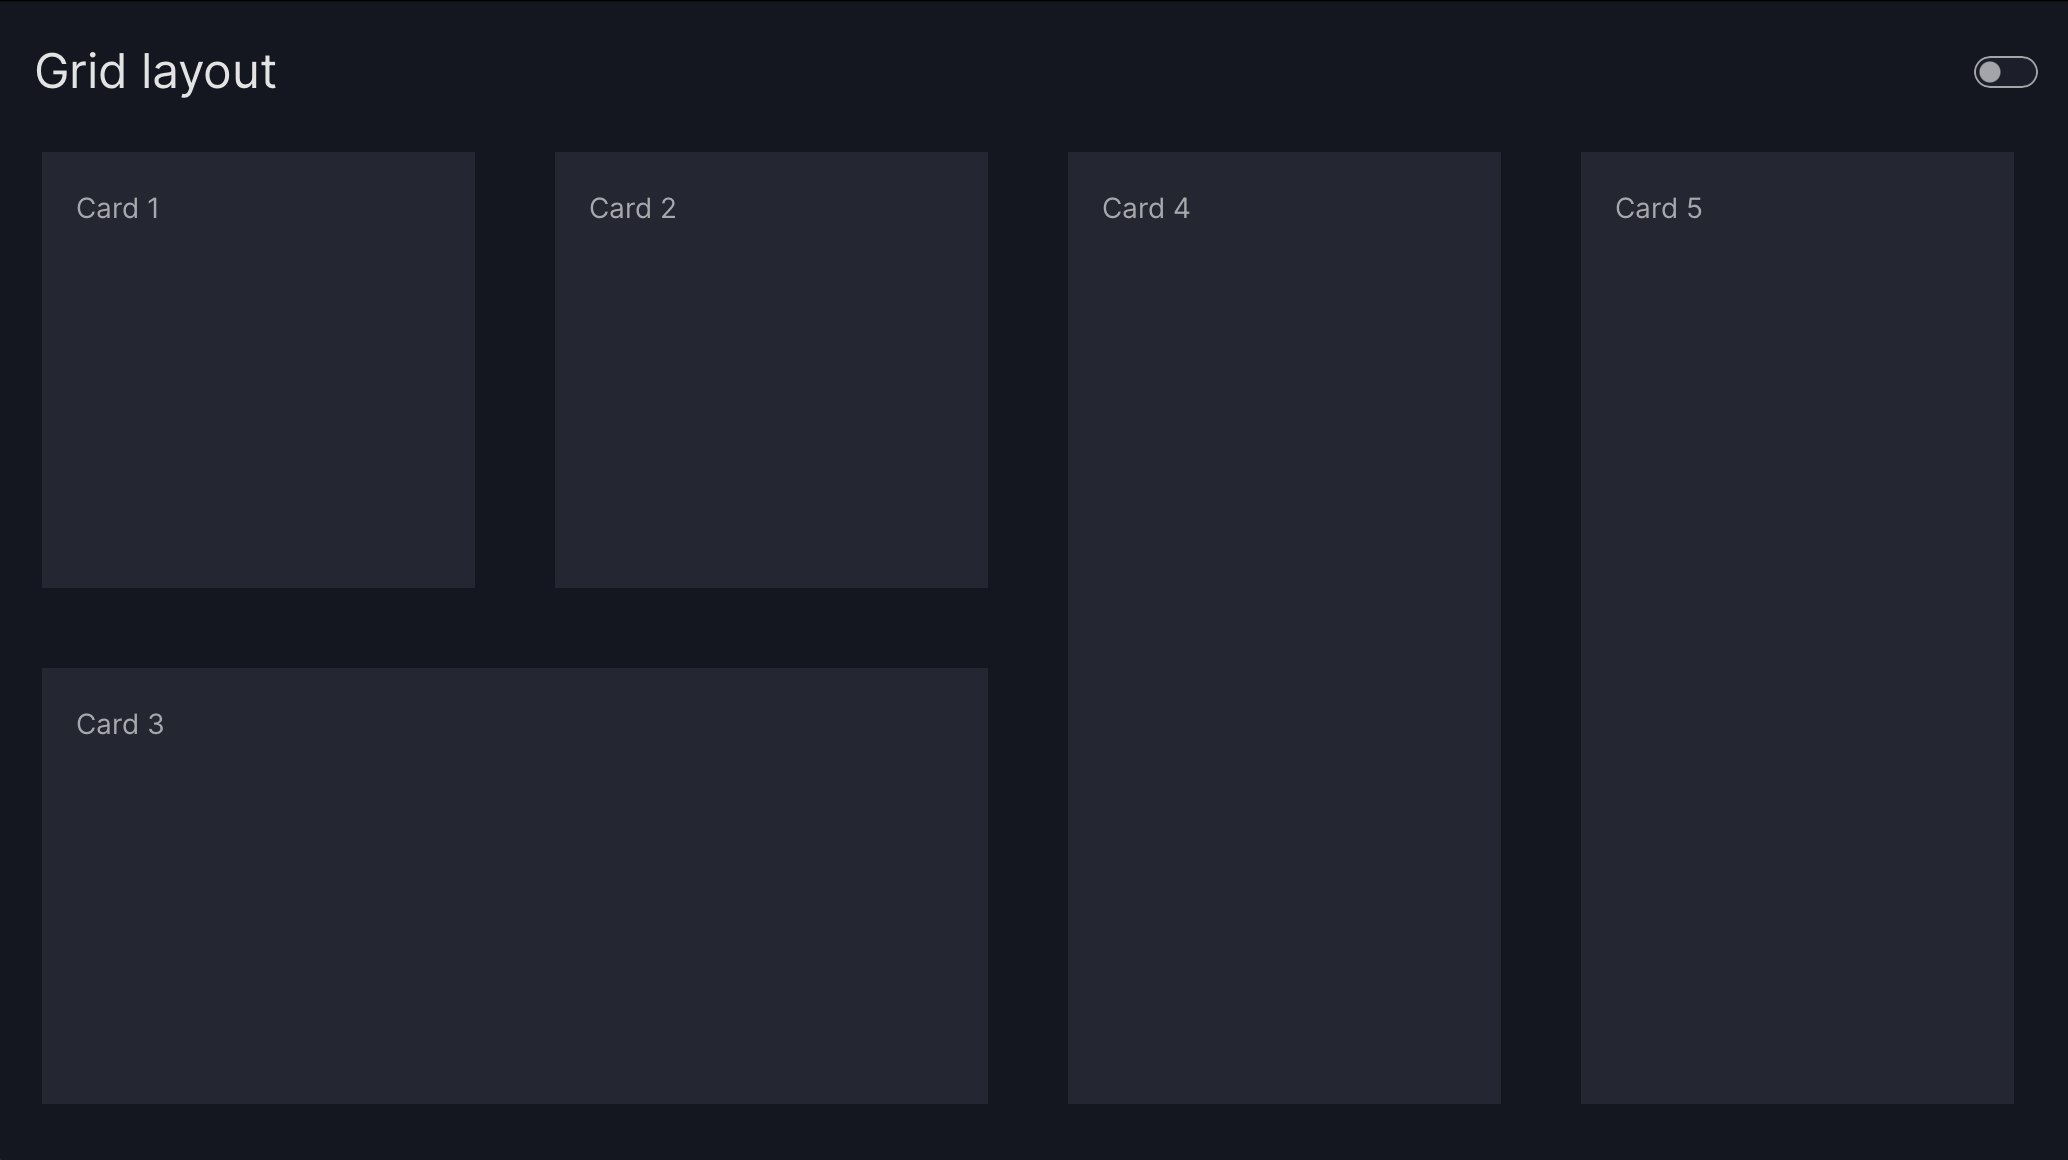
import vizro.models as vm
from vizro import Vizro

page = vm.Page(
    title="Grid layout",
    layout=vm.Grid(
        grid=[
            [0, 1, 3, 4],
            [2, 2, 3, 4]
        ]
    ),
    components=[
        vm.Card(text="Card 1"),
        vm.Card(text="Card 2"),
        vm.Card(text="Card 3"),
        vm.Card(text="Card 4"),
        vm.Card(text="Card 5"),
    ],
)

Vizro().build(vm.Dashboard(pages=[page])).run()
Flex
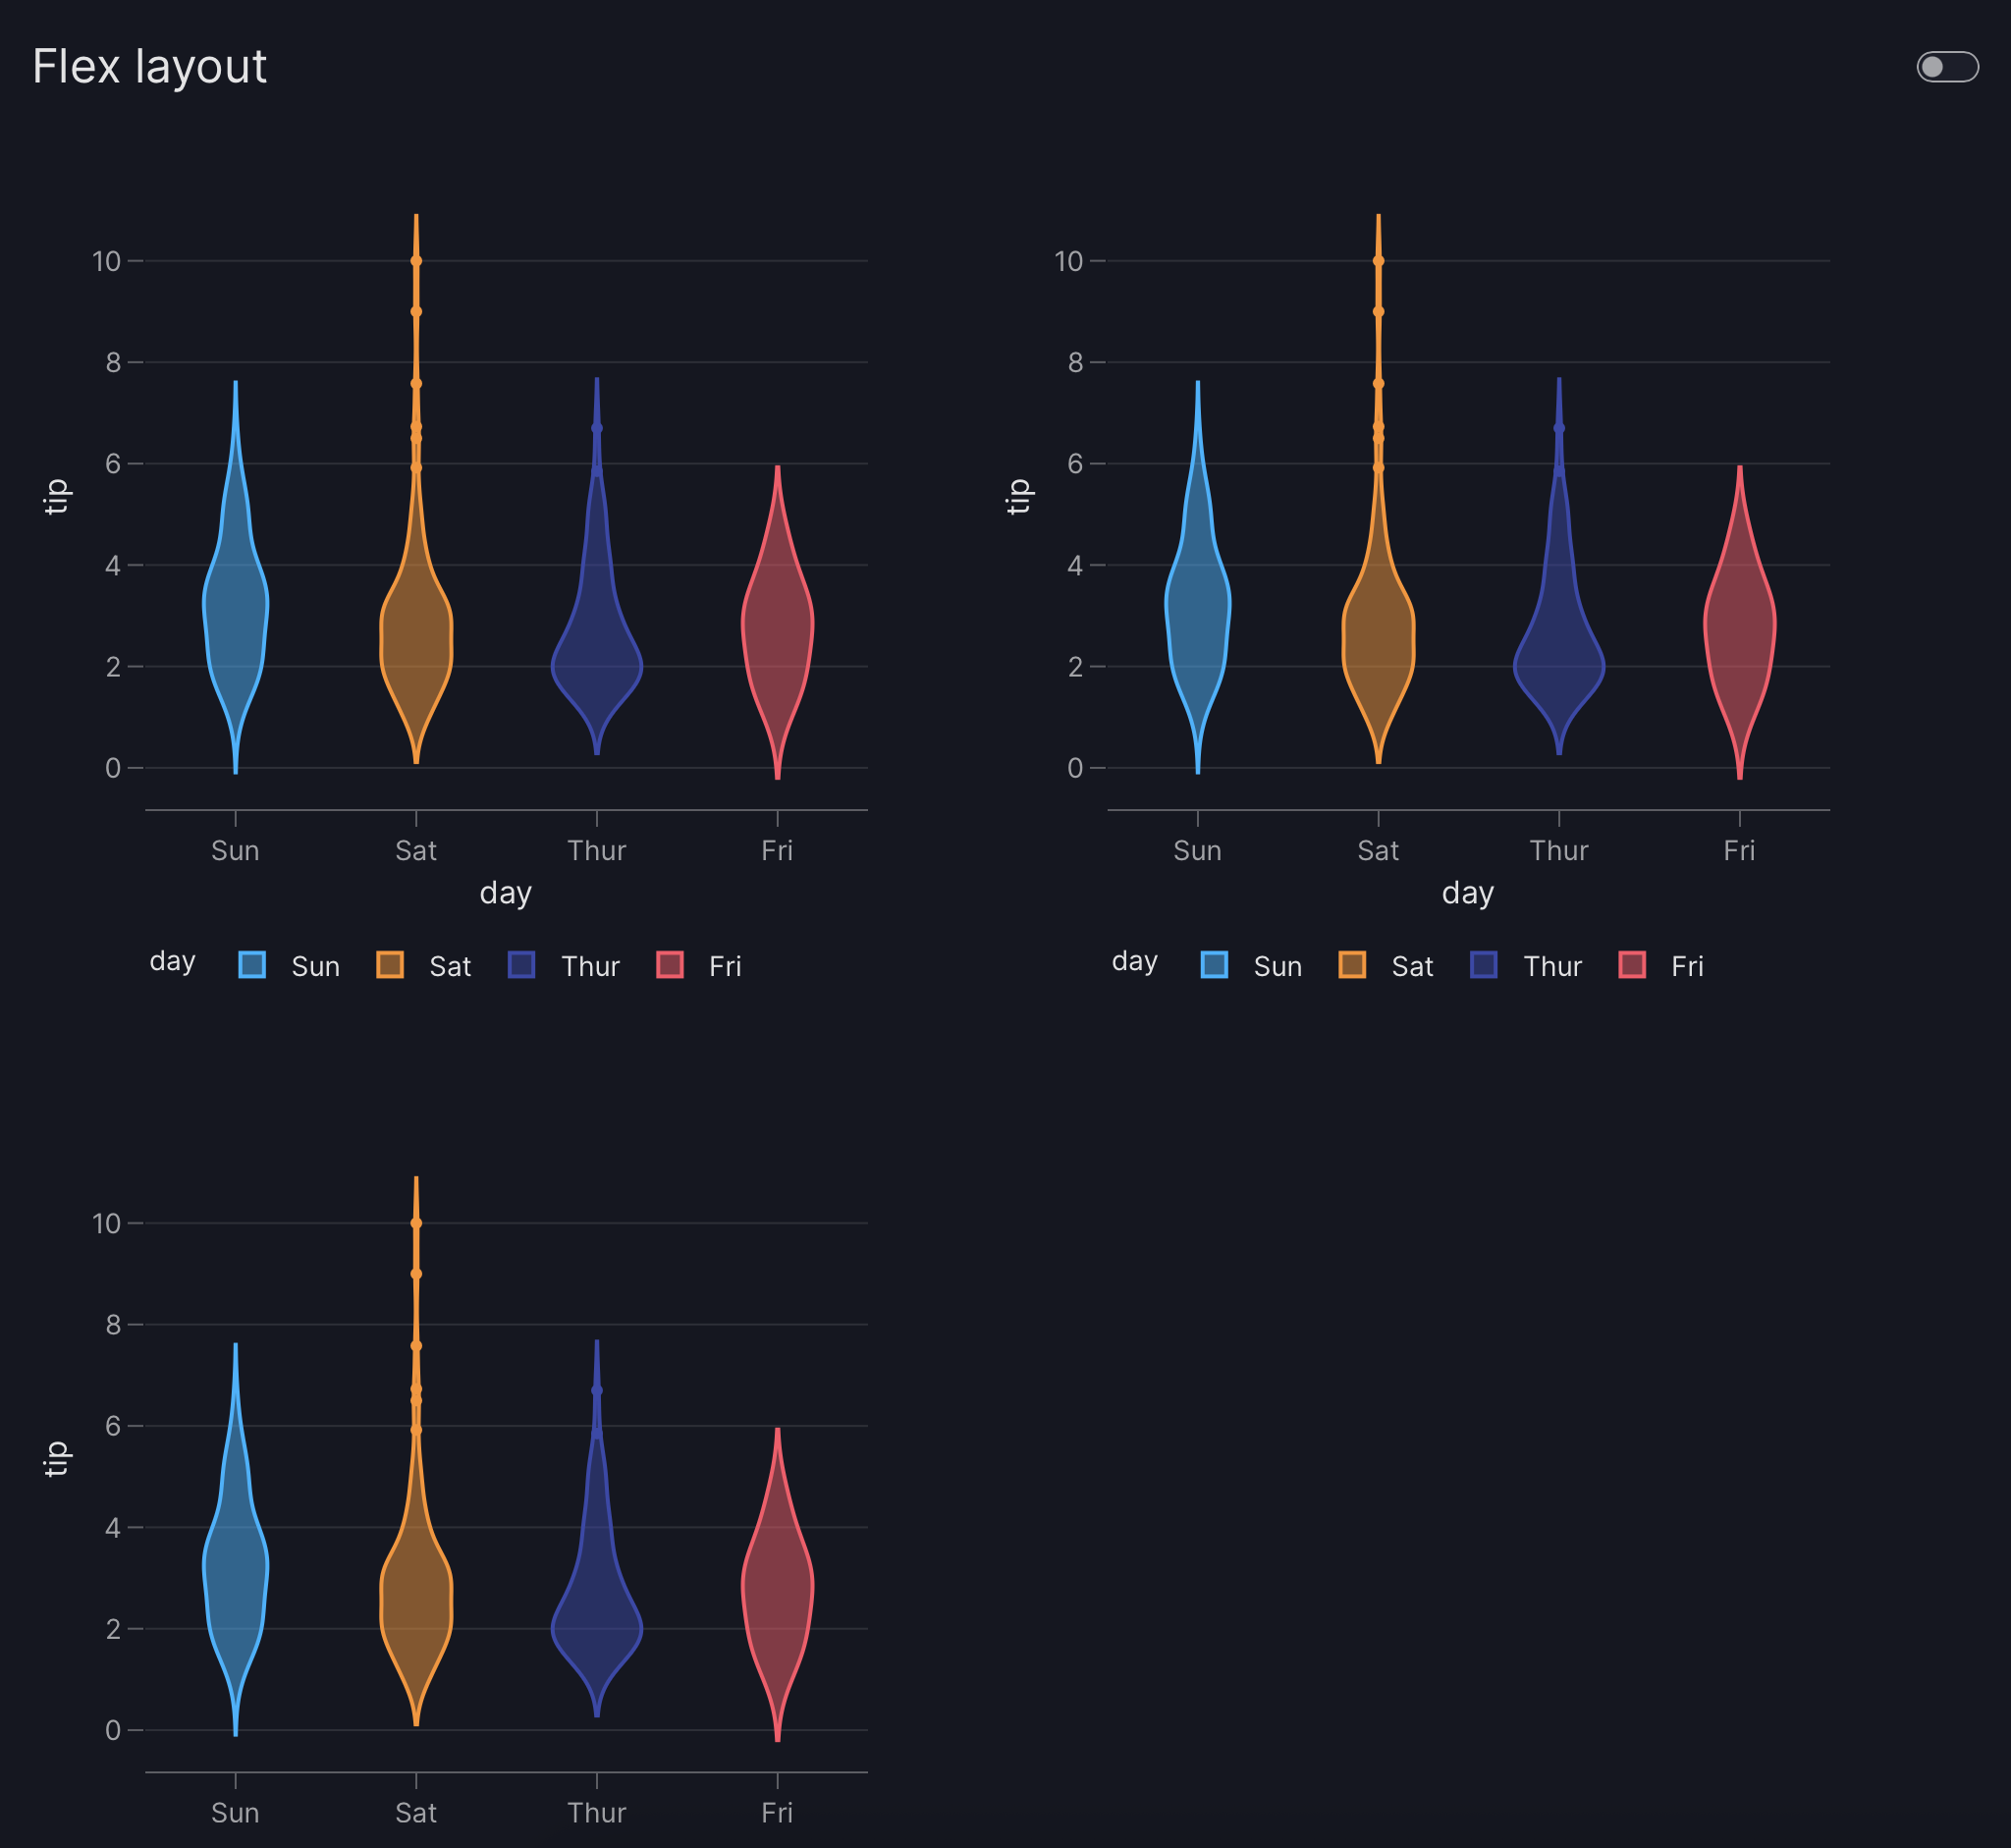
import vizro.models as vm
from vizro import Vizro
import vizro.plotly.express as px

tips = px.data.tips()

page = vm.Page(
    title="Flex layout",
    layout=vm.Flex(
        direction="row",
        gap="40px",
        wrap=True
    ),
    components=[
        vm.Graph(
            figure=px.violin(
                tips,
                y="tip",
                x="day",
                color="day"
            )
        ) for i in range(3)
    ],
)

Vizro().build(vm.Dashboard(pages=[page])).run()
Controls
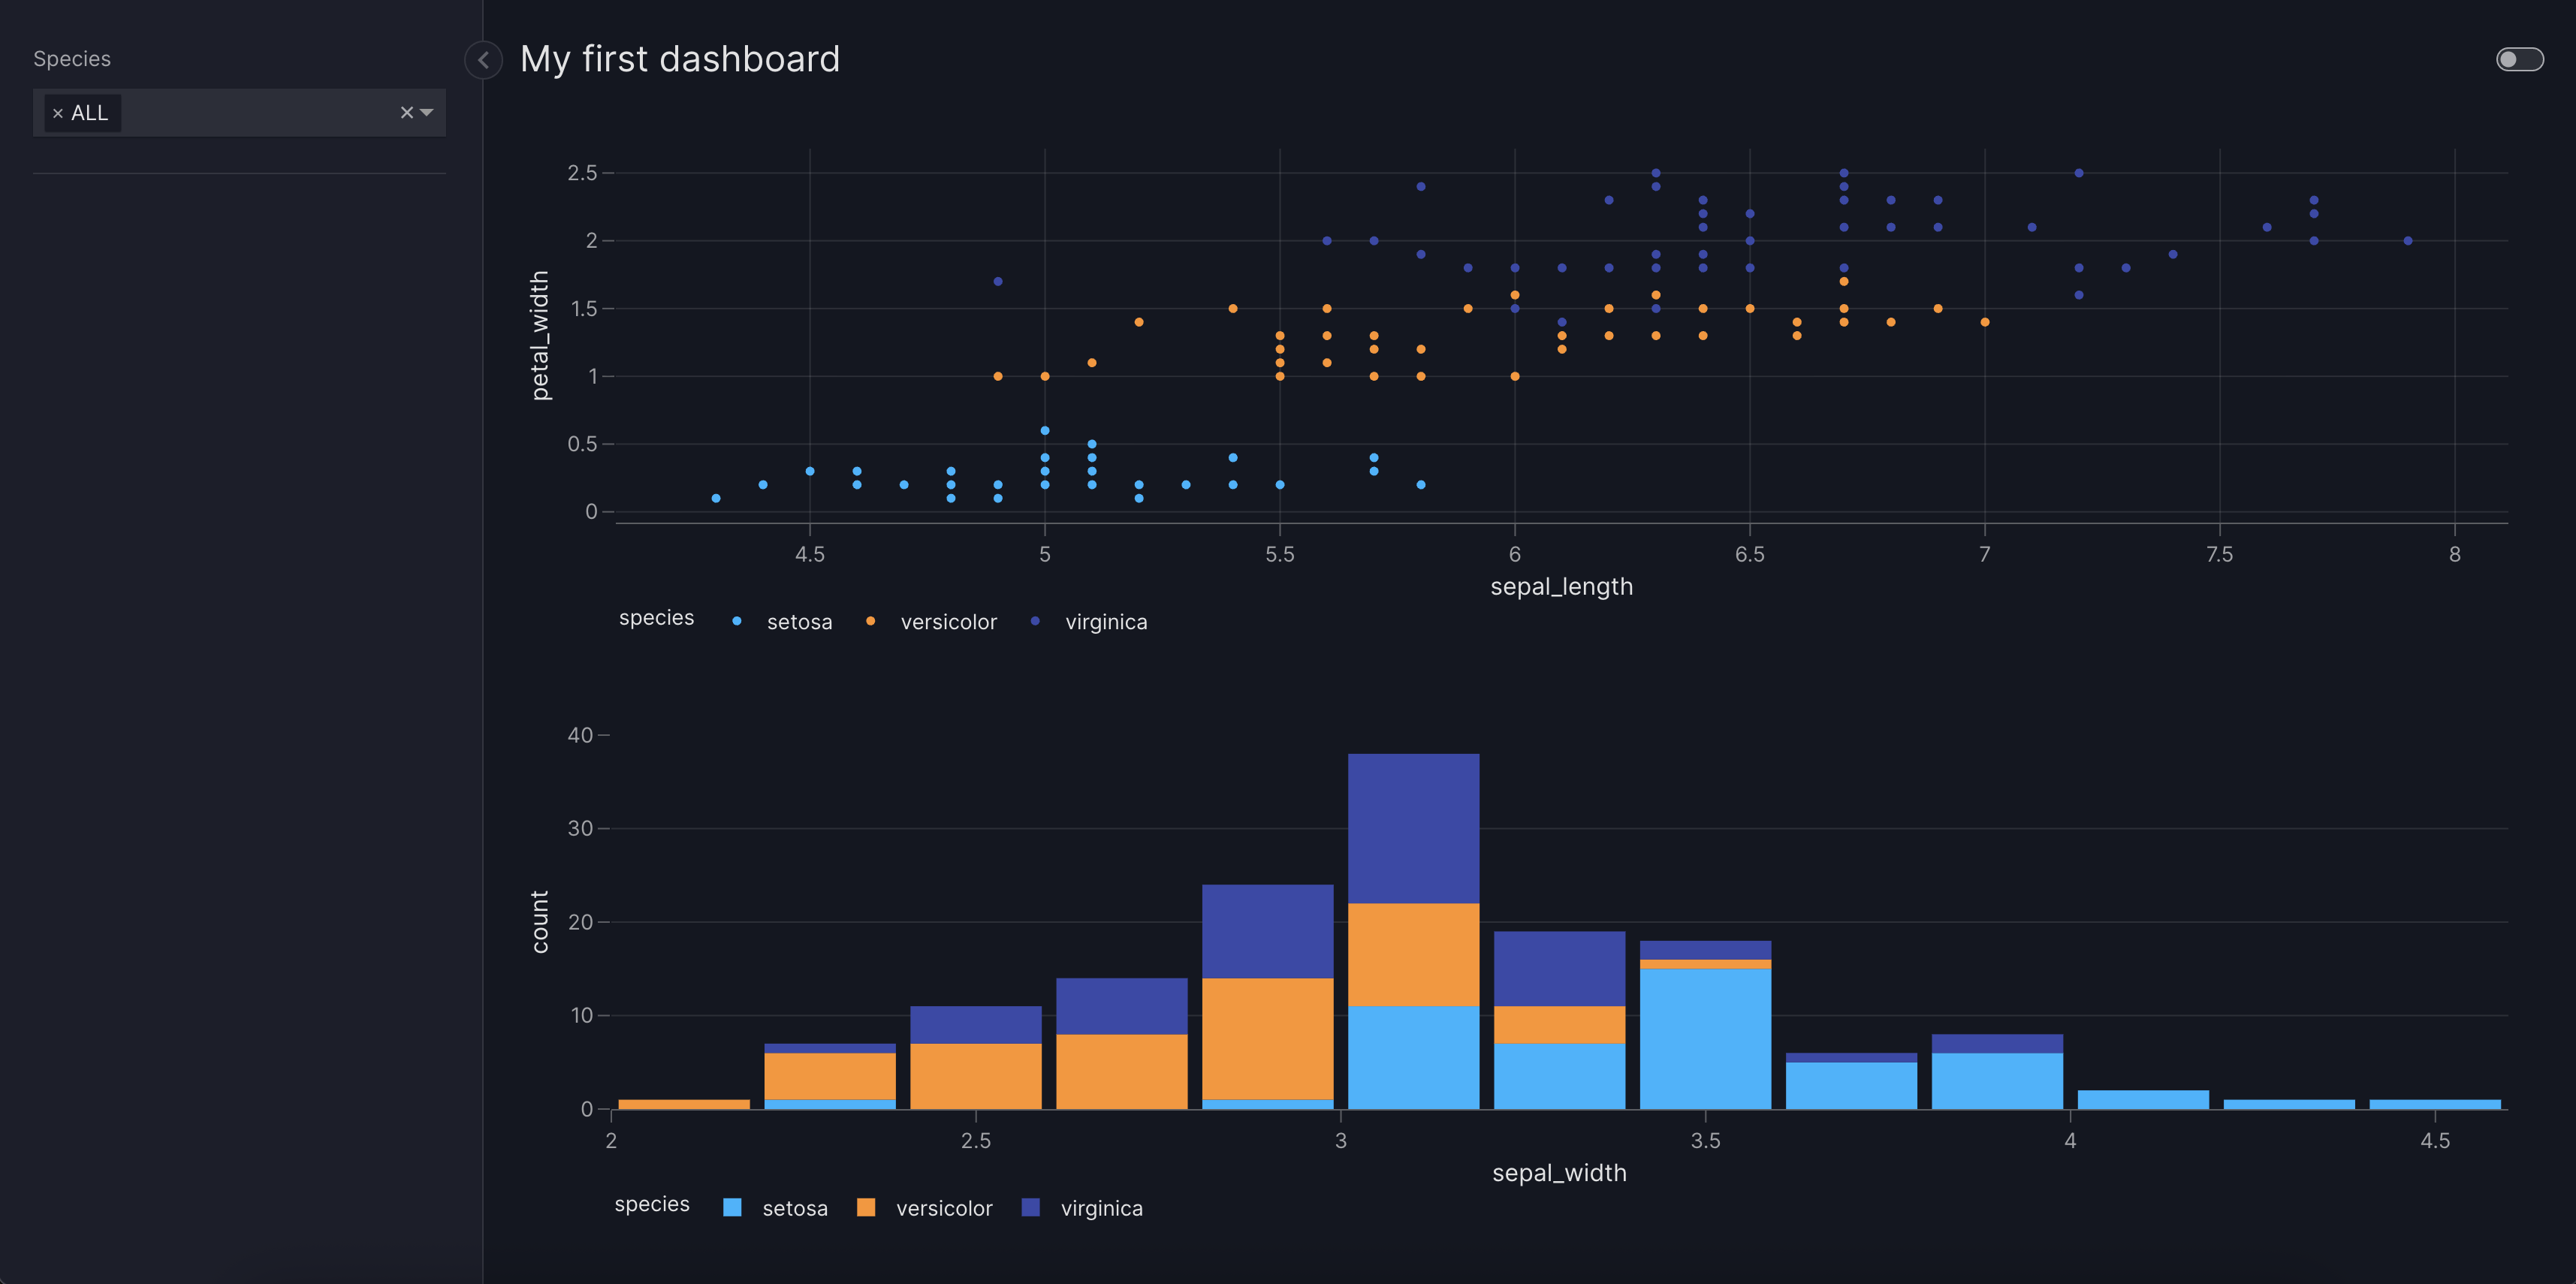
Filter
import vizro.plotly.express as px
from vizro import Vizro
import vizro.models as vm

iris = px.data.iris()

page = vm.Page(
    title="Filter",
    components=[
        vm.Graph(
            figure=px.scatter(
                iris,
                x="sepal_length",
                y="petal_width",
                color="species",
            ),
        ),
    ],
    controls=[
        vm.Filter(column="species"),
    ],
)

Vizro().build(vm.Dashboard(pages=[page])).run()
Parameter
import vizro.plotly.express as px
from vizro import Vizro
import vizro.models as vm

iris = px.data.iris()

page = vm.Page(
    title="Parameter",
    components=[
        vm.Graph(
            id="scatter_chart",
            figure=px.scatter(
                iris,
                title="My scatter chart",
                x="sepal_length",
                y="petal_width",
                color="species"
            ),
        ),
    ],
    controls=[
        vm.Parameter(
            targets=["scatter_chart.title"],
            selector=vm.Dropdown(
                options=[
                    "My scatter chart",
                    "A better title!"
                ],
                multi=False,
            ),
        ),
    ],
)

Vizro().build(vm.Dashboard(pages=[page])).run()
Selectors
The Filter or the Parameter model accept the selector argument, where a selector model can be entered to choose how the user should input their choices for the respective models.
Dropdown
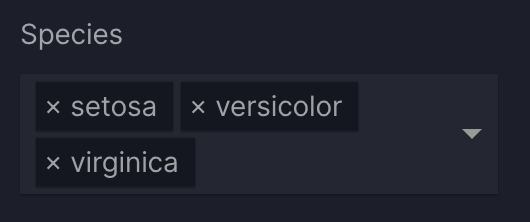
controls=[
    vm.Filter(
        column="species",
        selector=vm.Dropdown(
            title="Species"
        )
    )
]
Checklist

controls=[
    vm.Filter(
        column="species",
        selector=vm.Checklist(
            title="Species"
        )
    )
]
RadioItems

controls=[
    vm.Filter(
        column="species",
        selector=vm.RadioItems(
            title="Species"
        )
    )
]
Slider
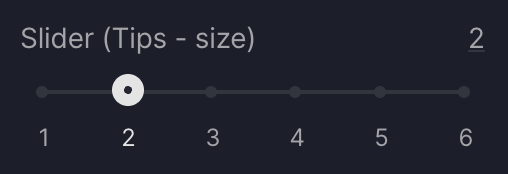
controls=[
    vm.Filter(
        column="size",
        selector=vm.Slider(
            title="Slider (Tips - size)",
            step=1,
            value=2
        ),
    ),
]
RangeSlider

controls=[
    vm.Filter(
        column="lifeExp",
        selector=vm.RangeSlider(
            title="Range Slider (Gapminder - lifeExp)",
            step=1,
            marks=None
        ),
    )
]
DatePicker (single date)

controls=[
    vm.Filter(
        column="date",
        selector=vm.DatePicker(
            title="Date Picker (Stocks - date)",
            range=False,
        )
    ),
]
DatePicker (date range)

controls=[
    vm.Filter(
        column="date",
        selector=vm.DatePicker(
            title="Date Picker (Stocks - date)",
        )
    ),
]
TimePicker (single time)

controls=[
    vm.Filter(
        column="time",
        selector=vm.TimePicker(
            title="Time Picker (Stocks - date)",
            range=False,
        )
    ),
]
TimePicker (time range)
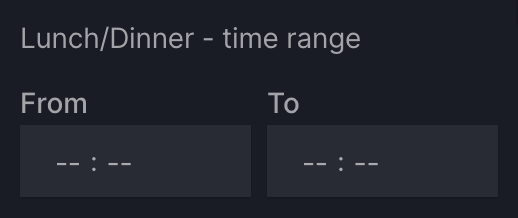
controls=[
    vm.Filter(
        column="time",
        selector=vm.timePicker(
            title="Time Picker (Stocks - date)",
        )
    ),
]
Switch

controls=[
    vm.Filter(
        column="species",
        selector=vm.Switch(title="Is Europe?"),
    )
]
Cascader
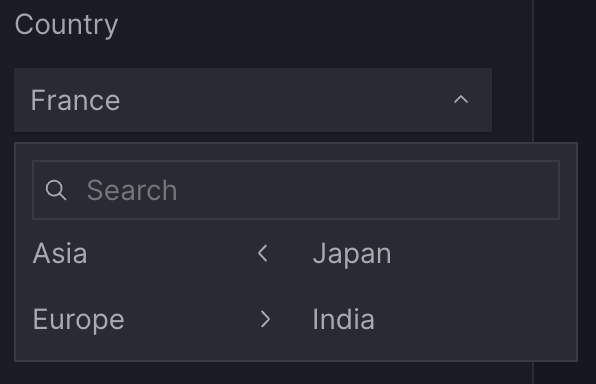
controls=[
    vm.Filter(
        column=["continent", "country"],
        selector=vm.Cascader(
            title="Continent",
            options={
                "Asia": ["Japan", "India"],
                "Europe": ["West", "North"],
            },
        ),
    )
]
Actions
Export data
Use the export_data action to download all data shown on a dashboard page, including graphs, tables, and figures. Exported files reflect filters and dynamic parameters applied to the page, but not interactions made directly within charts or tables (such as zooming or in-chart filters).
import vizro.plotly.express as px
import vizro.actions as va
import vizro.models as vm
from vizro import Vizro

df = px.data.iris()

page = vm.Page(
    title="Actions - export_data",
    components=[
        vm.Graph(
            figure=px.histogram(df, x="sepal_length")
        ),
        vm.Button(
            text="Export data",
            actions=va.export_data()
        ),
    ],
    controls=[vm.Filter(column="species")],
)

Vizro().build(vm.Dashboard(pages=[page])).run()
Graph & table interactions
In Vizro, interactions between components are enabled through an explicitly defined intermediate control. Cross-filtering, cross-parameter updates, and cross-highlighting all use the set_control action, providing a flexible and powerful way to link components.
import vizro.plotly.express as px
import vizro.actions as va
import vizro.models as vm
from vizro import Vizro
from vizro.tables import dash_ag_grid

tips = px.data.tips()

page = vm.Page(
    title="Cross-filter from table to graph",
    components=[
        vm.AgGrid(
            title="""Click on a row to use that row's
            sex to filter graph""",
            figure=dash_ag_grid(tips),
            actions=va.set_control(
                control="sex_filter", value="sex"
            ),
        ),
        vm.Graph(
            id="tips_graph",
            figure=px.histogram(tips, x="tip")
        ),
    ],
    controls=[
        vm.Filter(
            id="sex_filter",
            column="sex",
            targets=["tips_graph"]
        )
    ],
)
Vizro().build(vm.Dashboard(pages=[page])).run()
Notifications
The show_notification action displays a temporary message in the top-right of the screen to inform users about successes, warnings, errors, information, or loading states. Notifications can be customized with a title, text, and styling options such as variants and icons.
import vizro.plotly.express as px
import vizro.actions as va
import vizro.models as vm
from vizro import Vizro

df = px.data.iris()

page = vm.Page(
    title="Export with notification",
    layout=vm.Flex(),
    components=[
        vm.Graph(
            figure=px.histogram(df, x="sepal_length")
        ),
        vm.Button(
            text="Export data",
            actions=[
                va.export_data(),
                va.show_notification(
                    text="Data exported successfully!",
                    variant="success",
                    icon="download",
                ),
            ],
        ),
    ],
)

Vizro().build(vm.Dashboard(pages=[page])).run()