How to use parameters
This guide shows you how to add parameters to your dashboard. A parameter sets any argument other than data_frame in the figure function of a component. For example, a user could select using a dropdown which variable is plotted on the x-axis of a graph. Parameters can also be used to set dynamic data parameters. The following components are reactive to parameters:
- built-in graphs and custom graphs
- built-in tables and custom tables
- built-in figures and custom figures
It is possible to add parameters to a page or container. Both the Page model and the Container model have an optional controls argument where you can give any number of controls including parameters.
When the dashboard is running there are two ways for a user to set a parameter:
- Direct user interaction with the underlying selector. For example, the user selects values from a checklist.
- User interaction with a graph or table via the
set_controlaction. This enables functionality such as cross-highlighting. To achieve a visually cleaner dashboard you might like to hide the parameter's underlying selector withvisible=False.
Basic parameters
To add a parameter to your page, do the following:
- add the
Parametermodel into thecontrolsargument of thePagemodel. - add the
targetsargument - add a selector model to the
selectorargument.
In the targets argument, you can specify the component and function argument that the parameter should be applied to in the form of <target_component_id>.<target_argument> (for example, scatter_chart.title).
Unlike for the Filter model, you also have to configure the selector argument, by providing it with an appropriate model and the desired options/numeric ranges.
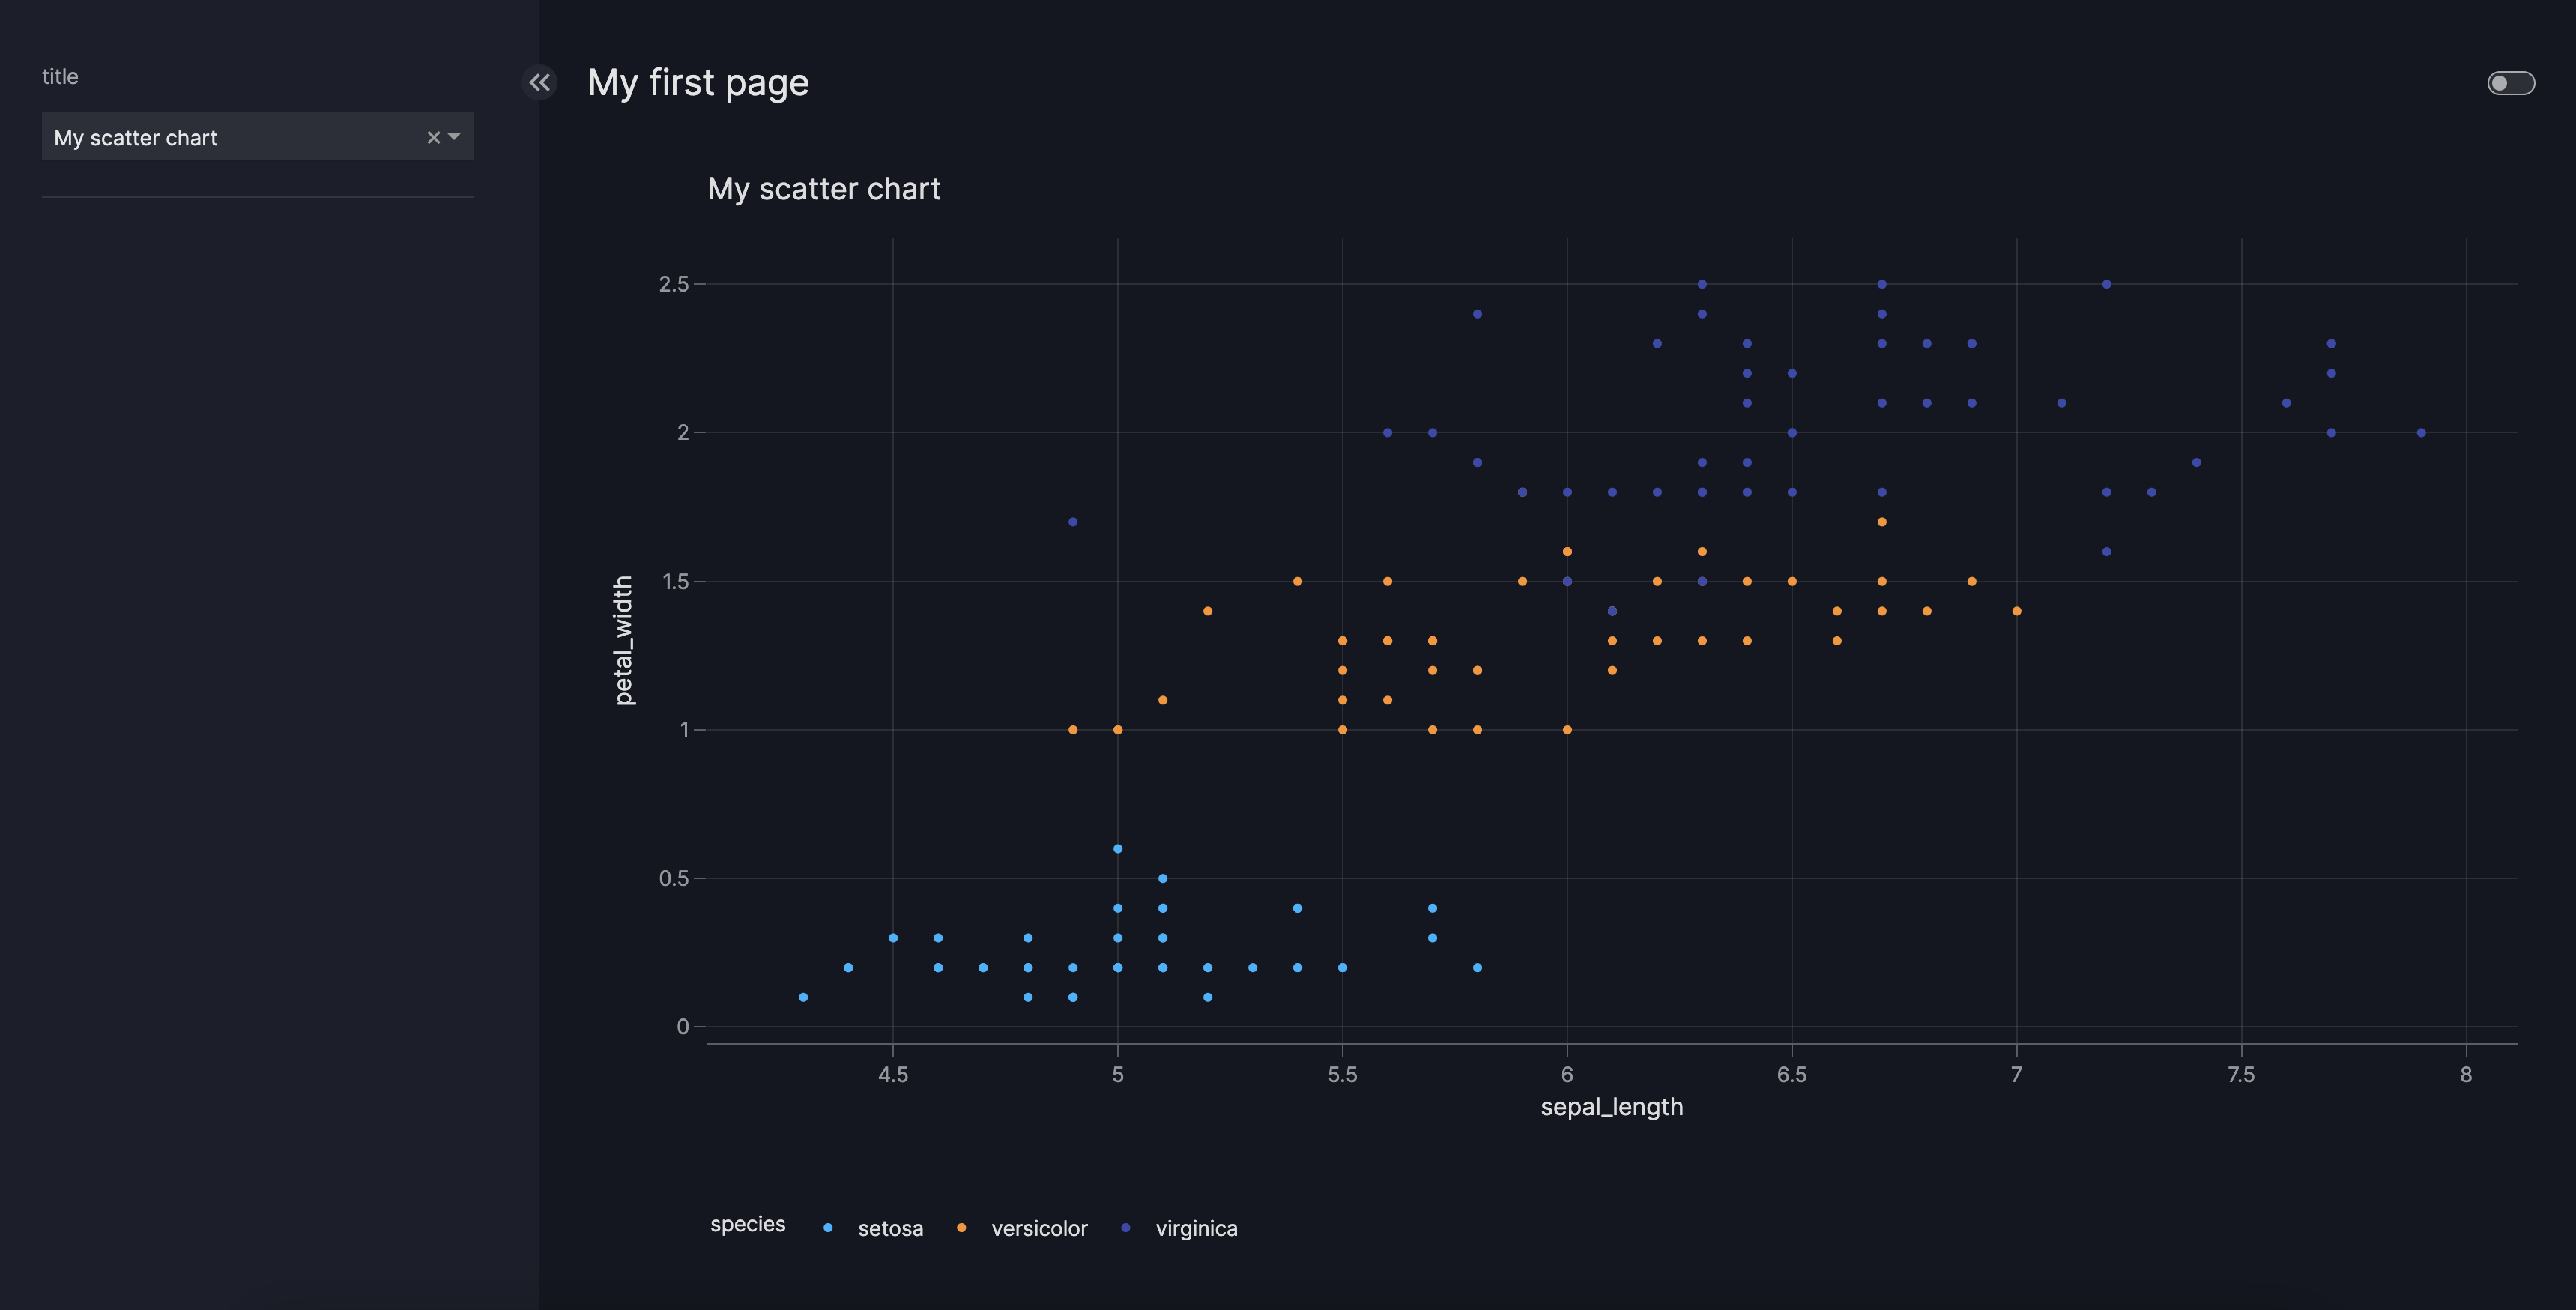
Basic Parameter
from vizro import Vizro
import vizro.plotly.express as px
import vizro.models as vm

iris = px.data.iris()

page = vm.Page(
    title="My first page",
    components=[
        vm.Graph(
            id="scatter_chart",
            figure=px.scatter(iris, title="My scatter chart", x="sepal_length", y="petal_width", color="species"),
        ),
    ],
    controls=[
        vm.Parameter(
            targets=["scatter_chart.title"],
            selector=vm.Dropdown(
                options=["My scatter chart", "A better title!", "Another title..."],
                multi=False,
            ),
        ),
    ],
)

dashboard = vm.Dashboard(pages=[page])
Vizro().build(dashboard).run()
![]() Run and edit this code in Py.Cafe
Run and edit this code in Py.Cafe
# Still requires a .py to add data to the data manager and parse YAML configuration
# See yaml_version example
pages:
  - components:
      - figure:
          _target_: scatter
          data_frame: iris
          x: sepal_length
          y: petal_width
          color: species
        id: scatter_chart
        type: graph
    controls:
      - selector:
          options: [My scatter chart, A better title!, Another title...]
          multi: false
          type: dropdown
        targets:
          - scatter_chart.title
        type: parameter
    title: My first page
If you would like to pass None as a parameter and make a parameter optional, you can specify the string "NONE" in the options or value field.
Nested parameters
If you want to change nested parameters, you can specify the targets argument with a dot separated string like <target_component_id>.<target_argument>.<first_hierarchy>.
Nested Parameters for multiple targets
from vizro import Vizro
import vizro.plotly.express as px
import vizro.models as vm

iris = px.data.iris()

page = vm.Page(
    title="My first page",
    components=[
        vm.Graph(
            id="scatter_chart",
            figure=px.scatter(
                iris,
                x="sepal_width",
                y="sepal_length",
                color="species",
                size="petal_length",
                color_discrete_map={"setosa": "#097DFE", "versicolor": "#6F39E3"},
            ),
        ),
        vm.Graph(
            id="bar_chart",
            figure=px.bar(
                iris,
                x="sepal_width",
                y="sepal_length",
                color="species",
                color_discrete_map={"setosa": "#097DFE", "versicolor": "#6F39E3"},
            ),
        ),
    ],
    controls=[
        vm.Parameter(
            targets=["scatter_chart.color_discrete_map.virginica", "bar_chart.color_discrete_map.virginica"],
            selector=vm.Dropdown(
                options=["#05D0F0", "#0F766E"],
                multi=False,
                value="#05D0F0",
            ),
        ),
    ],
)

dashboard = vm.Dashboard(pages=[page])
Vizro().build(dashboard).run()
![]() Run and edit this code in Py.Cafe
Run and edit this code in Py.Cafe
# Still requires a .py to add data to the data manager and parse YAML configuration
# See yaml_version example
pages:
  - components:
      - figure:
          _target_: scatter
          data_frame: iris
          x: sepal_width
          y: sepal_length
          size: petal_length
          color: species
          color_discrete_map: {setosa: '#00b4ff', versicolor: '#ff9222'}
        id: scatter_chart
        type: graph
      - figure:
          _target_: bar
          data_frame: iris
          x: sepal_width
          y: sepal_length
          color: species
          color_discrete_map: {setosa: '#00b4ff', versicolor: '#ff9222'}
        id: bar_chart
        type: graph
    controls:
      - selector:
          options: ['#ff5267', '#3949ab']
          value: #3949ab
          multi: false
          type: dropdown
        targets:
          - scatter_chart.color_discrete_map.virginica
          - bar_chart.color_discrete_map.virginica
        type: parameter
    title: My first page
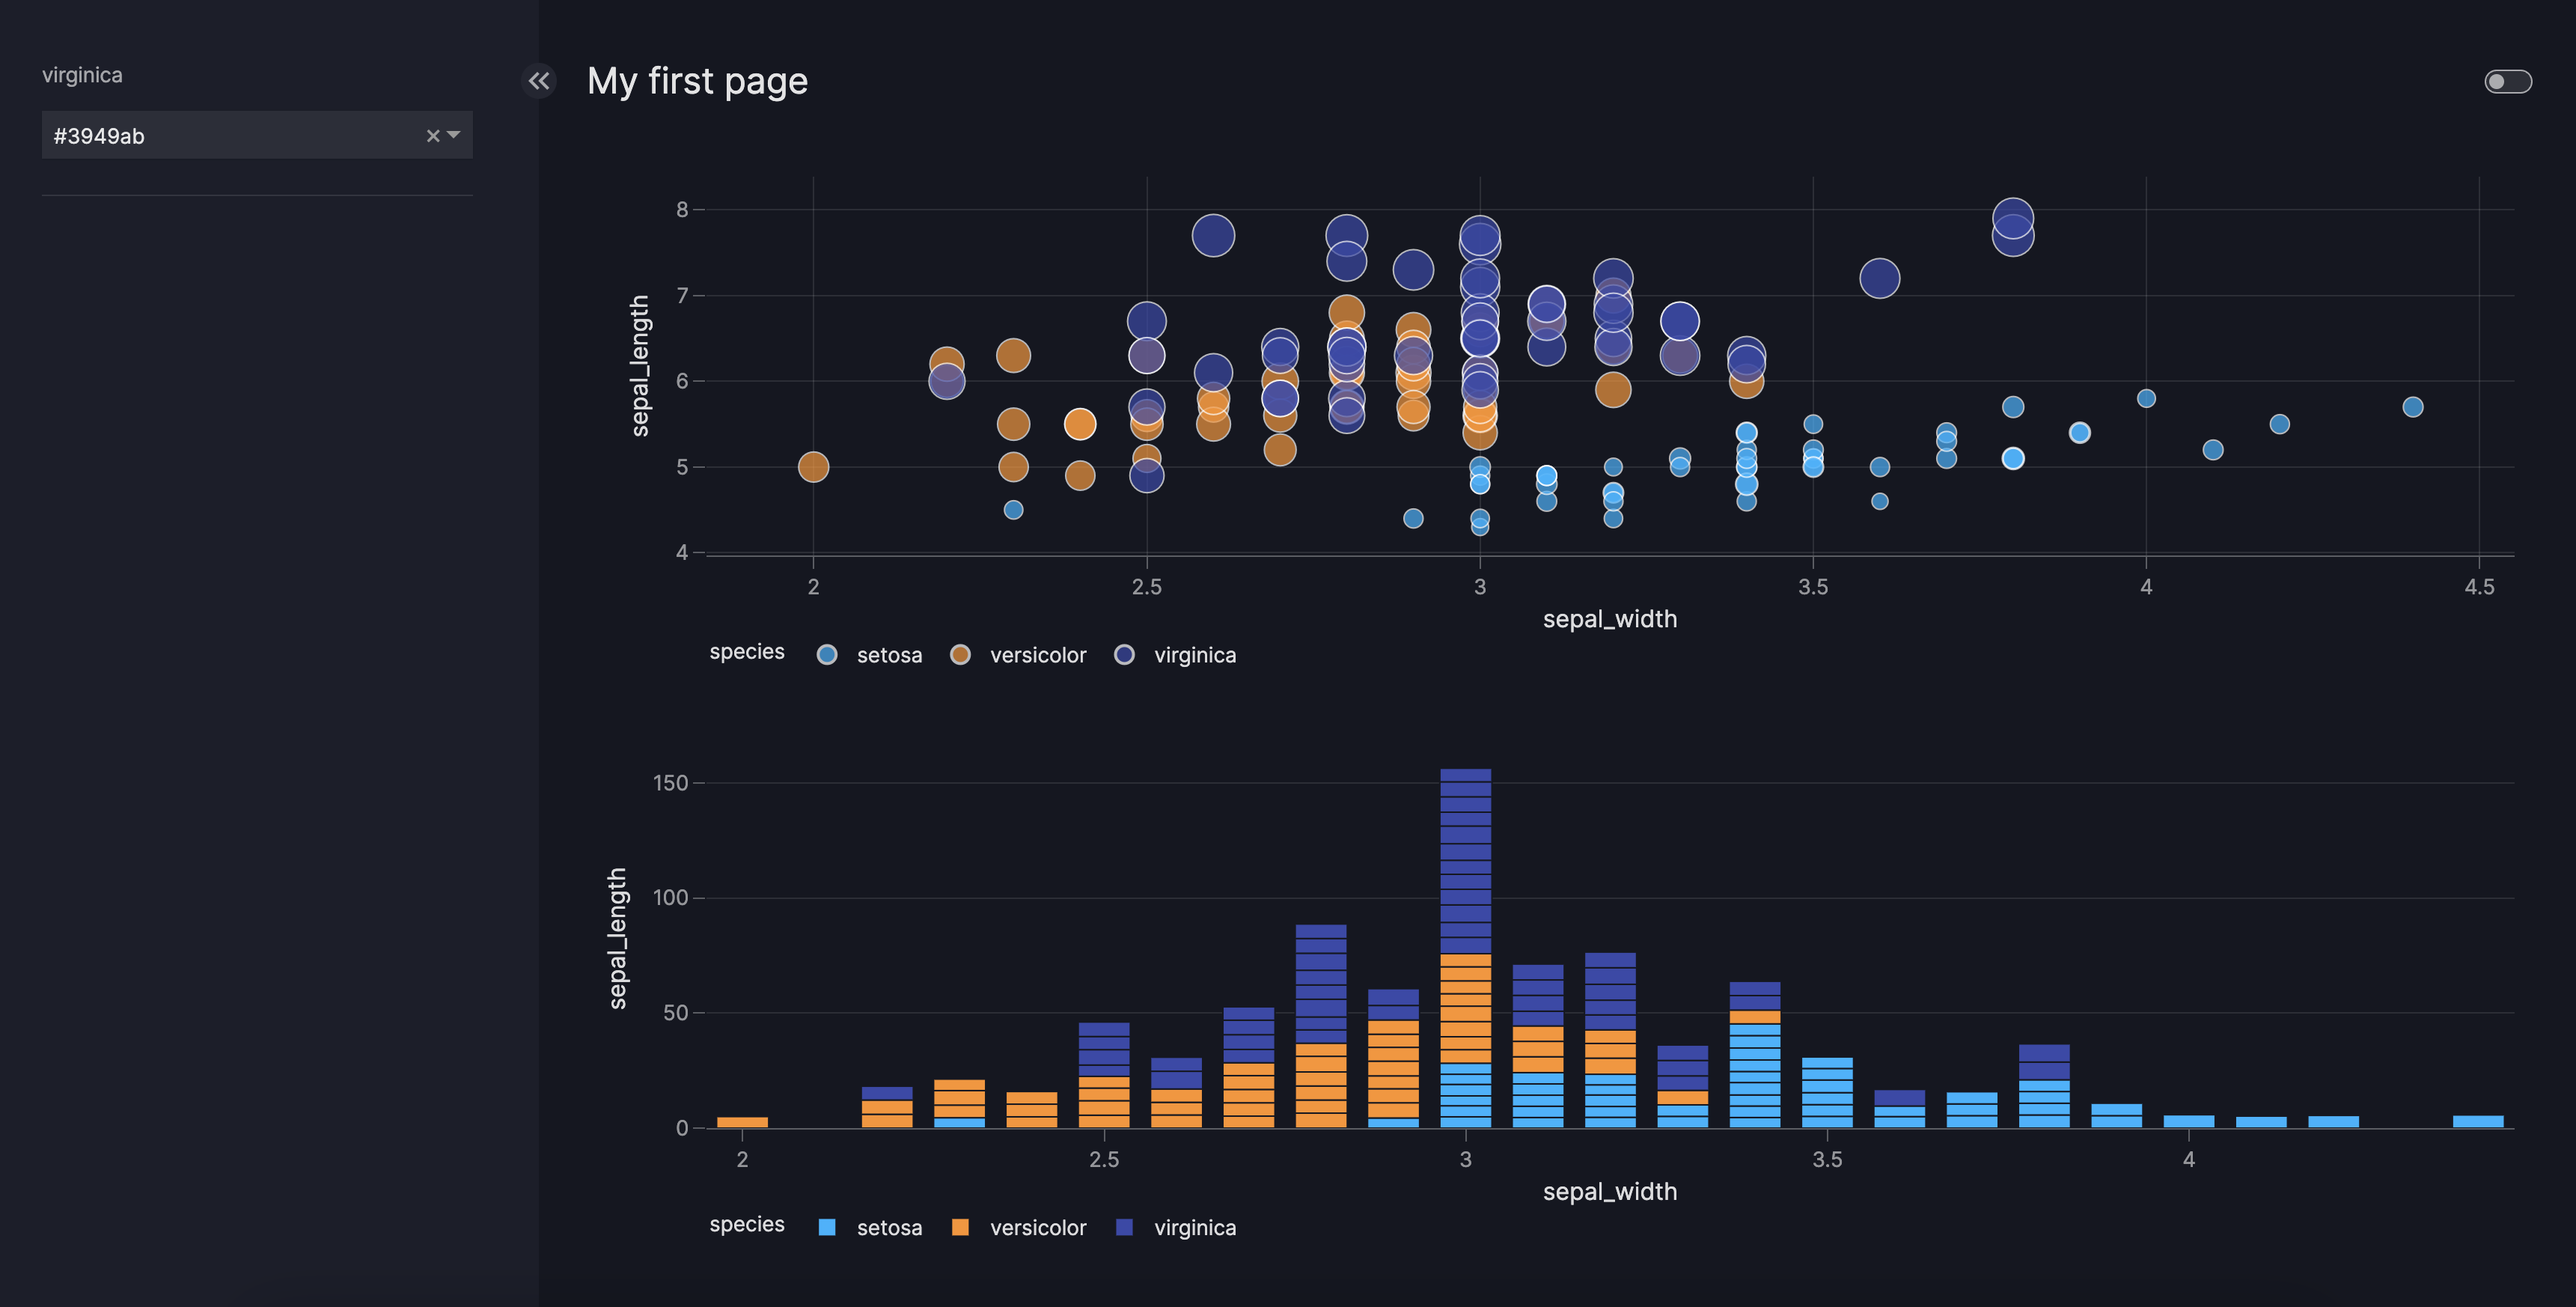
In the above example, the object passed to the function argument color_discrete_map is a dictionary which maps the different flower species to fixed colors (for example, {"virginica":"blue"}). In this case, only the value blue should be changed instead of the entire dictionary. This can be achieved by specifying a target as scatter.color_discrete_map.virginica.
Note that in the above example, one parameter affects multiple targets.
Dynamic data parameters
If you use dynamic data that can be updated while the dashboard is running then you can pass parameters to the dynamic data function to alter the data loaded into your dashboard. For detailed instructions, refer to the section on parametrized data loading.
Further customization
For further customizations, refer to the guide to selectors and the Parameter model. Some popular choices are:
- Customize the
selector. For example:multi, to switch between a multi-option and single-option selector;optionsfor a categorical parameter; orminandmaxfor a numerical parameter. - Make the parameter's selector invisible by setting
visible=False. This is particularly useful for graph interactions to hide the selector from the user interface while keeping the functionality active. Cross-highlighting is a common example of this pattern. For a complete code example, see the cross-highlighting section in the graph and table interactions guide.