How to use filters
This guide shows you how to add filters to your dashboard. A filter selects a subset of rows of a component's data to alter the appearance of that component. The following components are reactive to filters:
- built-in graphs and custom graphs
- built-in tables and custom tables
- built-in figures and custom figures
It is possible to add filters to a page or container. Both the Page model and the Container model have an optional controls argument where you can give any number of controls, including filters. A filter uses the Filter model to filter the data_frame of the figure function of a target component model such as Graph.
When the dashboard is running there are two ways for a user to set a filter:
- Direct user interaction with the underlying selector. For example, the user selects values from a checklist.
- User interaction with a graph or table via the
set_controlaction. This enables functionality such as cross-filtering. To achieve a visually cleaner dashboard you might like to hide the filter's underlying selector withvisible=False.
By default, filters that control components with dynamic data are dynamically updated when the underlying data changes while the dashboard is running.
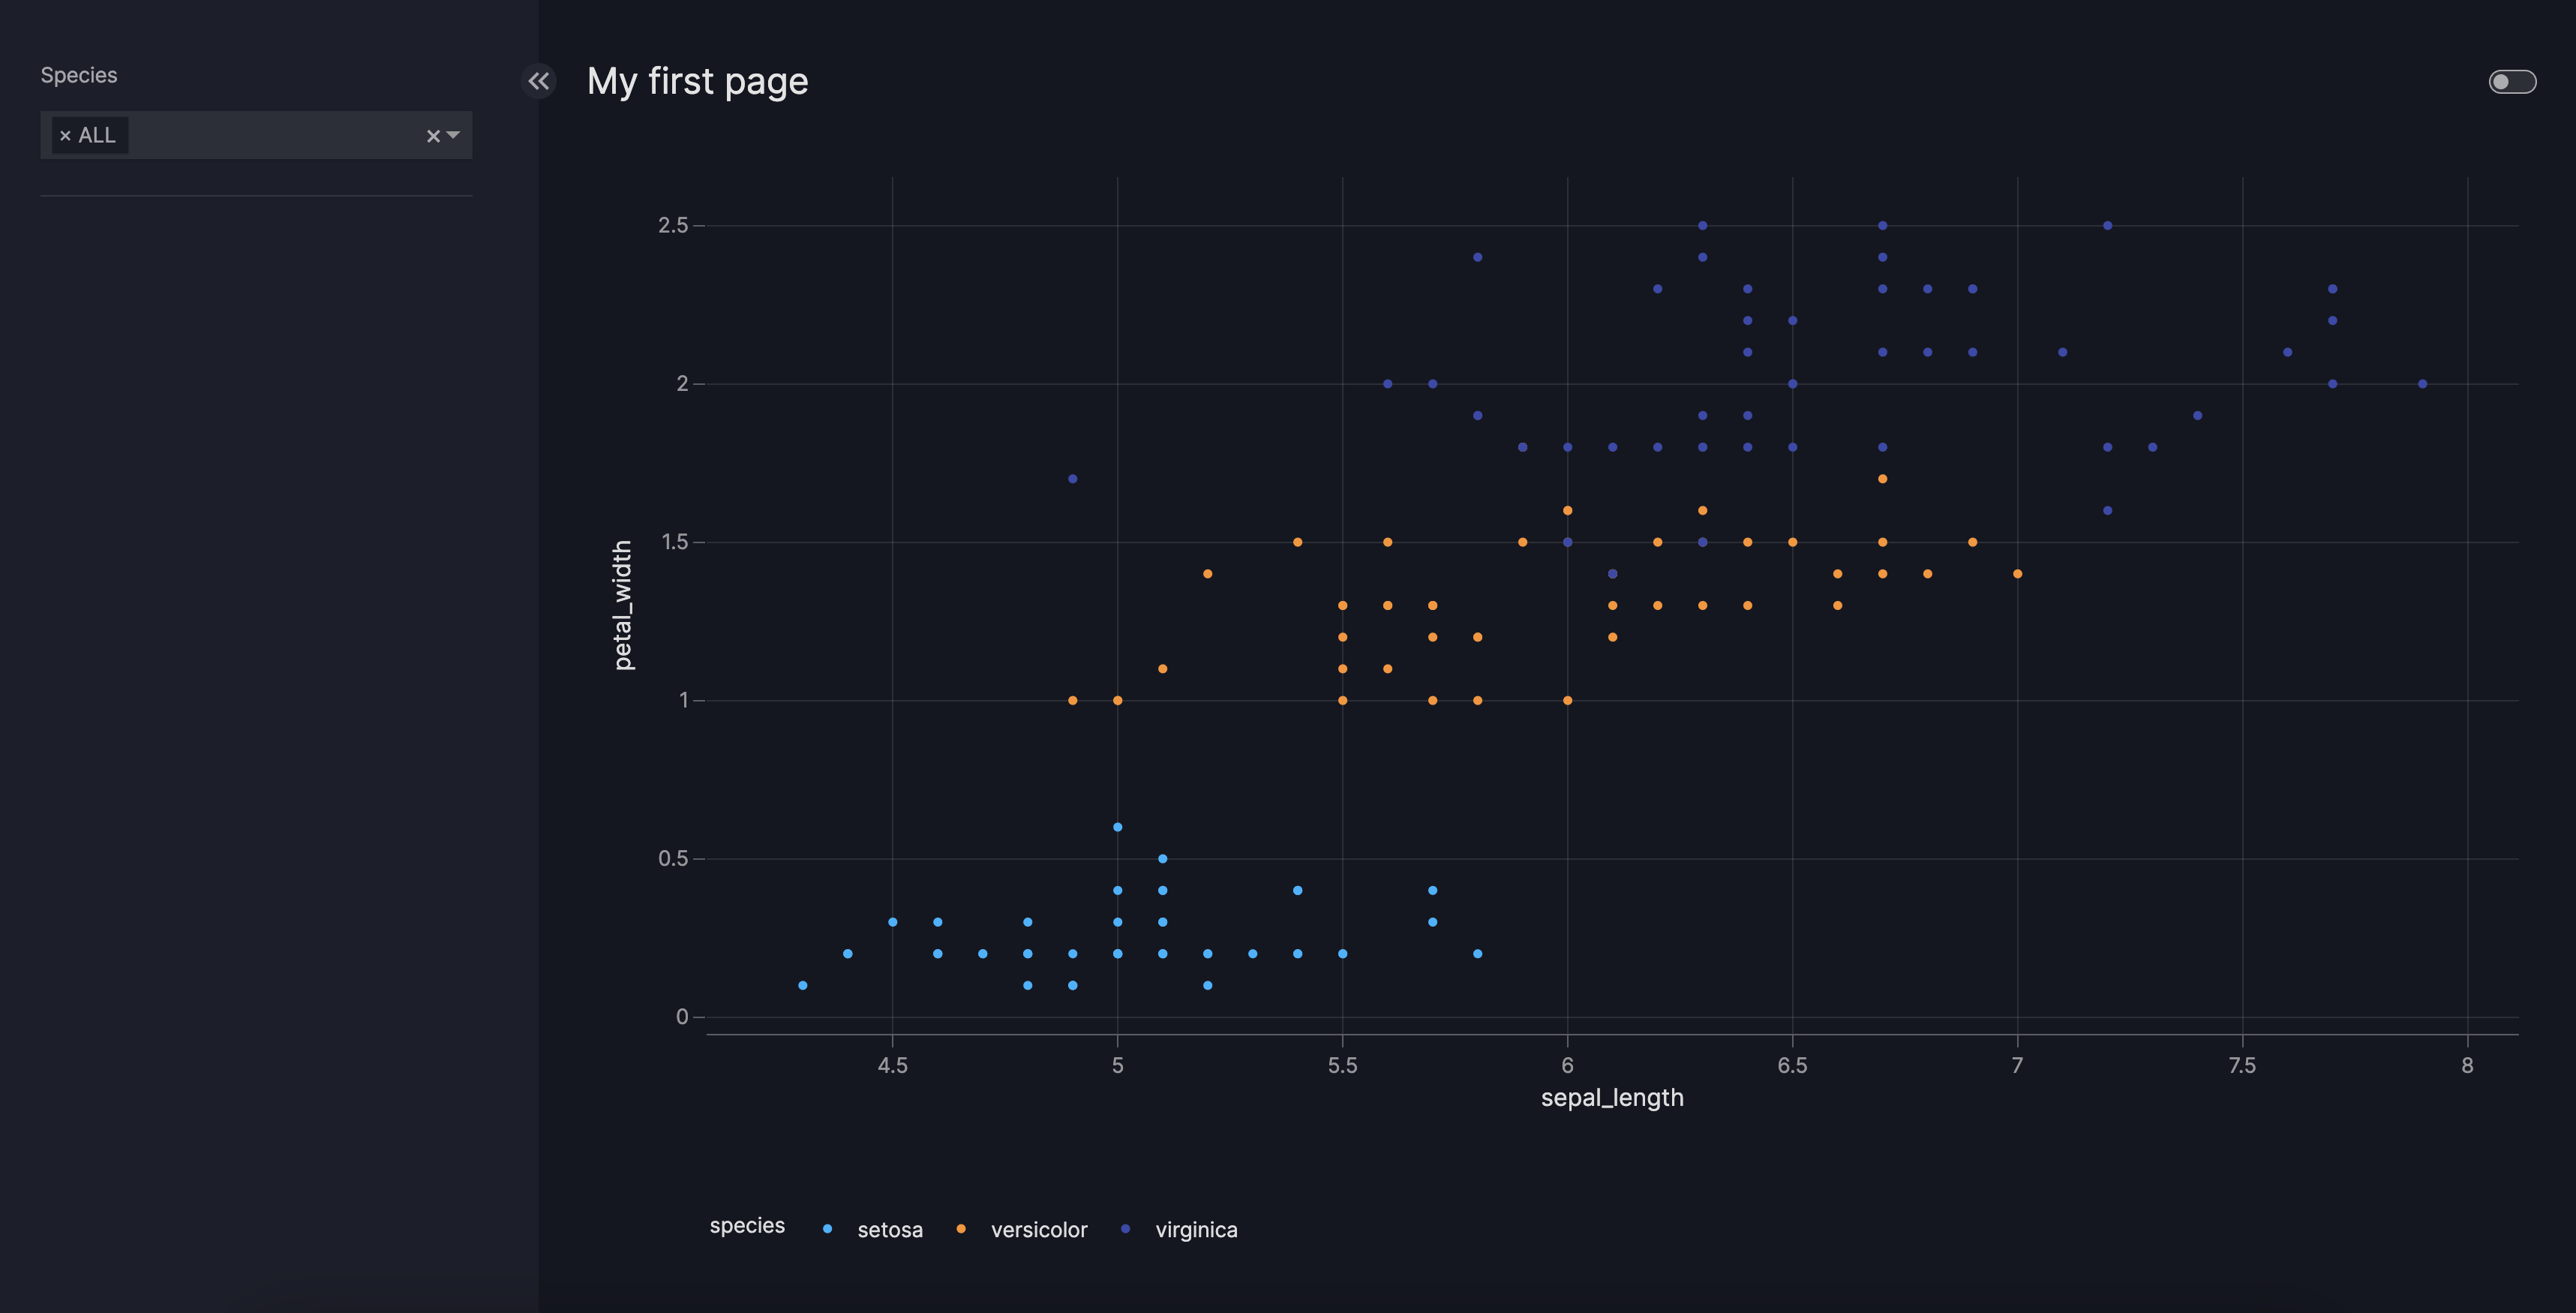
Basic filters
To add a filter to your page, do the following:
- add the
Filtermodel into thecontrolsargument of thePagemodel - configure the
columnargument, which denotes the target column to be filtered
You can also set targets to specify which components on the page the filter should apply to. If this is not explicitly set then targets defaults to all components on the page whose data source includes column.
Basic Filter
from vizro import Vizro
import vizro.plotly.express as px
import vizro.models as vm

iris = px.data.iris()

page = vm.Page(
    title="My first page",
    components=[
        vm.Graph(figure=px.scatter(iris, x="sepal_length", y="petal_width", color="species")),
    ],
    controls=[
        vm.Filter(column="species"),
    ],
)

dashboard = vm.Dashboard(pages=[page])
Vizro().build(dashboard).run()
![]() Run and edit this code in Py.Cafe
Run and edit this code in Py.Cafe
The selector is configured automatically based on the target column type data as follows:
- Categorical data uses
vm.Dropdown(multi=True)whereoptionsis the set of unique values found incolumnacross all the data sources of components intargets. - Numerical data uses
vm.RangeSliderwhereminandmaxare the overall minimum and maximum values found incolumnacross all the data sources of components intargets. - Temporal data (
dateordatetimecolumns) usesvm.DatePicker(range=True)whereminandmaxare the overall minimum and maximum values found incolumnacross all the data sources of components intargets. A column can be converted to this type withpandas.to_datetime. Fortimecolumns (containingdatetime.timeobjects),vm.TimePicker(range=True)is used instead; a column can be converted to this type withpandas.to_datetimefollowed by.time(for example,df["t"] = pd.to_datetime(df["t"]).time). - Boolean data uses
vm.Switchwhich provides a toggle interface for True/False values. The Switch also works with binary numerical columns containing 0/1 values.
The following example demonstrates these default selector types.
Default Filter selectors
import pandas as pd
from vizro import Vizro
import vizro.plotly.express as px
import vizro.models as vm

df_stocks = px.data.stocks(datetimes=True)

df_stocks_long = pd.melt(
    df_stocks,
    id_vars='date',
    value_vars=['GOOG', 'AAPL', 'AMZN', 'FB', 'NFLX', 'MSFT'],
    var_name='stocks',
    value_name='value'
)

df_stocks_long['value'] = df_stocks_long['value'].round(3)
df_stocks_long['Is GOOG?'] = df_stocks_long["stocks"] == "GOOG"

page = vm.Page(
    title="My first page",
    components=[
        vm.Graph(figure=px.line(df_stocks_long, x="date", y="value", color="stocks")),
    ],
    controls=[
        vm.Filter(column="stocks"),
        vm.Filter(column="value"),
        vm.Filter(column="date"),
        vm.Filter(column="Is GOOG?"),
    ],
)

dashboard = vm.Dashboard(pages=[page])
Vizro().build(dashboard).run()
![]() Run and edit this code in Py.Cafe
Run and edit this code in Py.Cafe
# Still requires a .py to add data to the data manager and parse YAML configuration
# See yaml_version example
pages:
  - components:
      - figure:
          _target_: line
          data_frame: df_stocks_long
          x: date
          y: value
          color: stocks
        type: graph
    controls:
      - column: stocks
        type: filter
      - column: value
        type: filter
      - column: date
        type: filter
      - column: Is GOOG?
        type: filter
    title: My first page

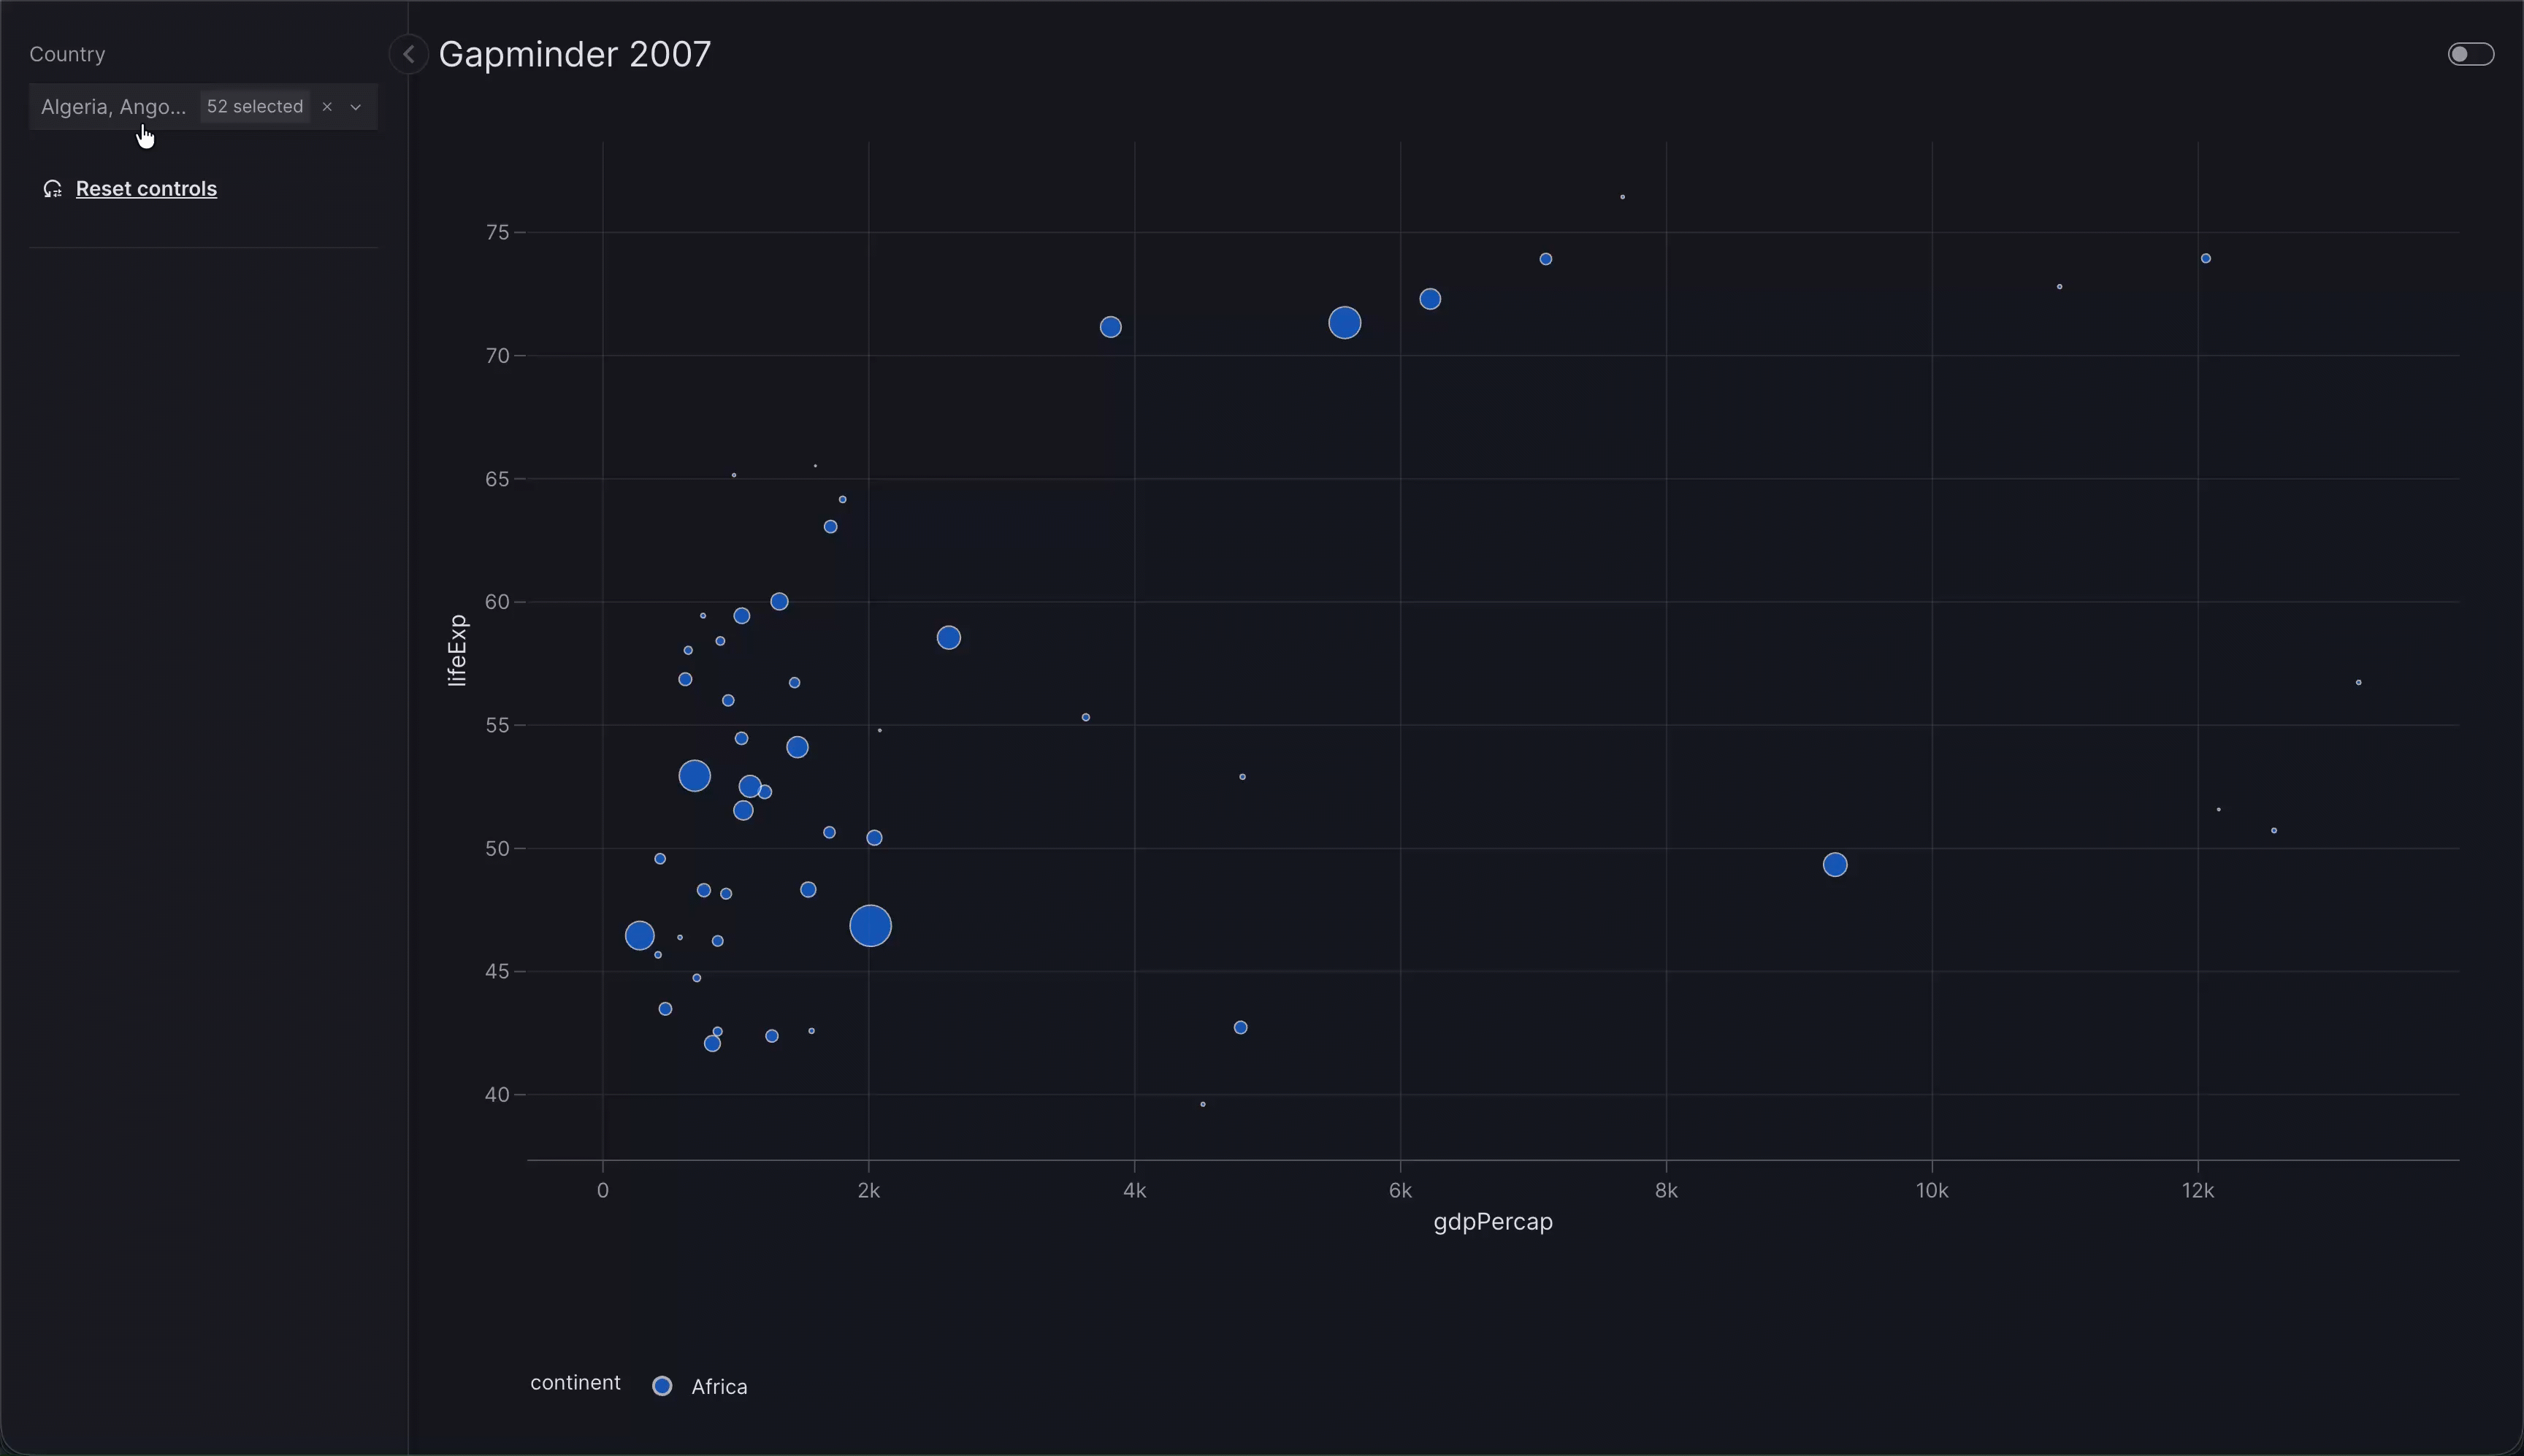
Hierarchical filters
A hierarchical filter is a filter where the user chooses values from a tree of grouped value. For example, cities around the world could be grouped into a hierarchy by continent and then by country. Rows of the data are filtered using the finest-grained (most "zoomed in") value (the leaves of the tree). In the continent/country/city example, this would be city.
To add a hierarchical filter to your page:
- add a
Filtertocontrols, the same as for a basic filter - set
columnto a list of at least two columns' names from the top level of the hierarchy down to the column you want to filter on
Hierarchical Filter
from vizro import Vizro
import vizro.plotly.express as px
import vizro.models as vm

gapminder = px.data.gapminder().query("year == 2007")

page = vm.Page(
    title="Gapminder 2007",
    components=[
        vm.Graph(
            figure=px.scatter(
                gapminder,
                x="gdpPercap",
                y="lifeExp",
                size="pop",
                hover_name="country",
                color="continent",
            )
        ),
    ],
    controls=[vm.Filter(column=["continent", "country"])],
)

dashboard = vm.Dashboard(pages=[page])
Vizro().build(dashboard).run()
![]() Run and edit this code in Py.Cafe
Run and edit this code in Py.Cafe
# Still requires a .py to add data to the data manager and parse YAML configuration
# See yaml_version example
pages:
  - components:
      - figure:
          _target_: scatter
          data_frame: gapminder
          x: gdpPercap
          y: lifeExp
          size: pop
          color: continent
          hover_name: country
        type: graph
    controls:
      - column:
          - continent
          - country
        type: filter
    title: Gapminder 2007
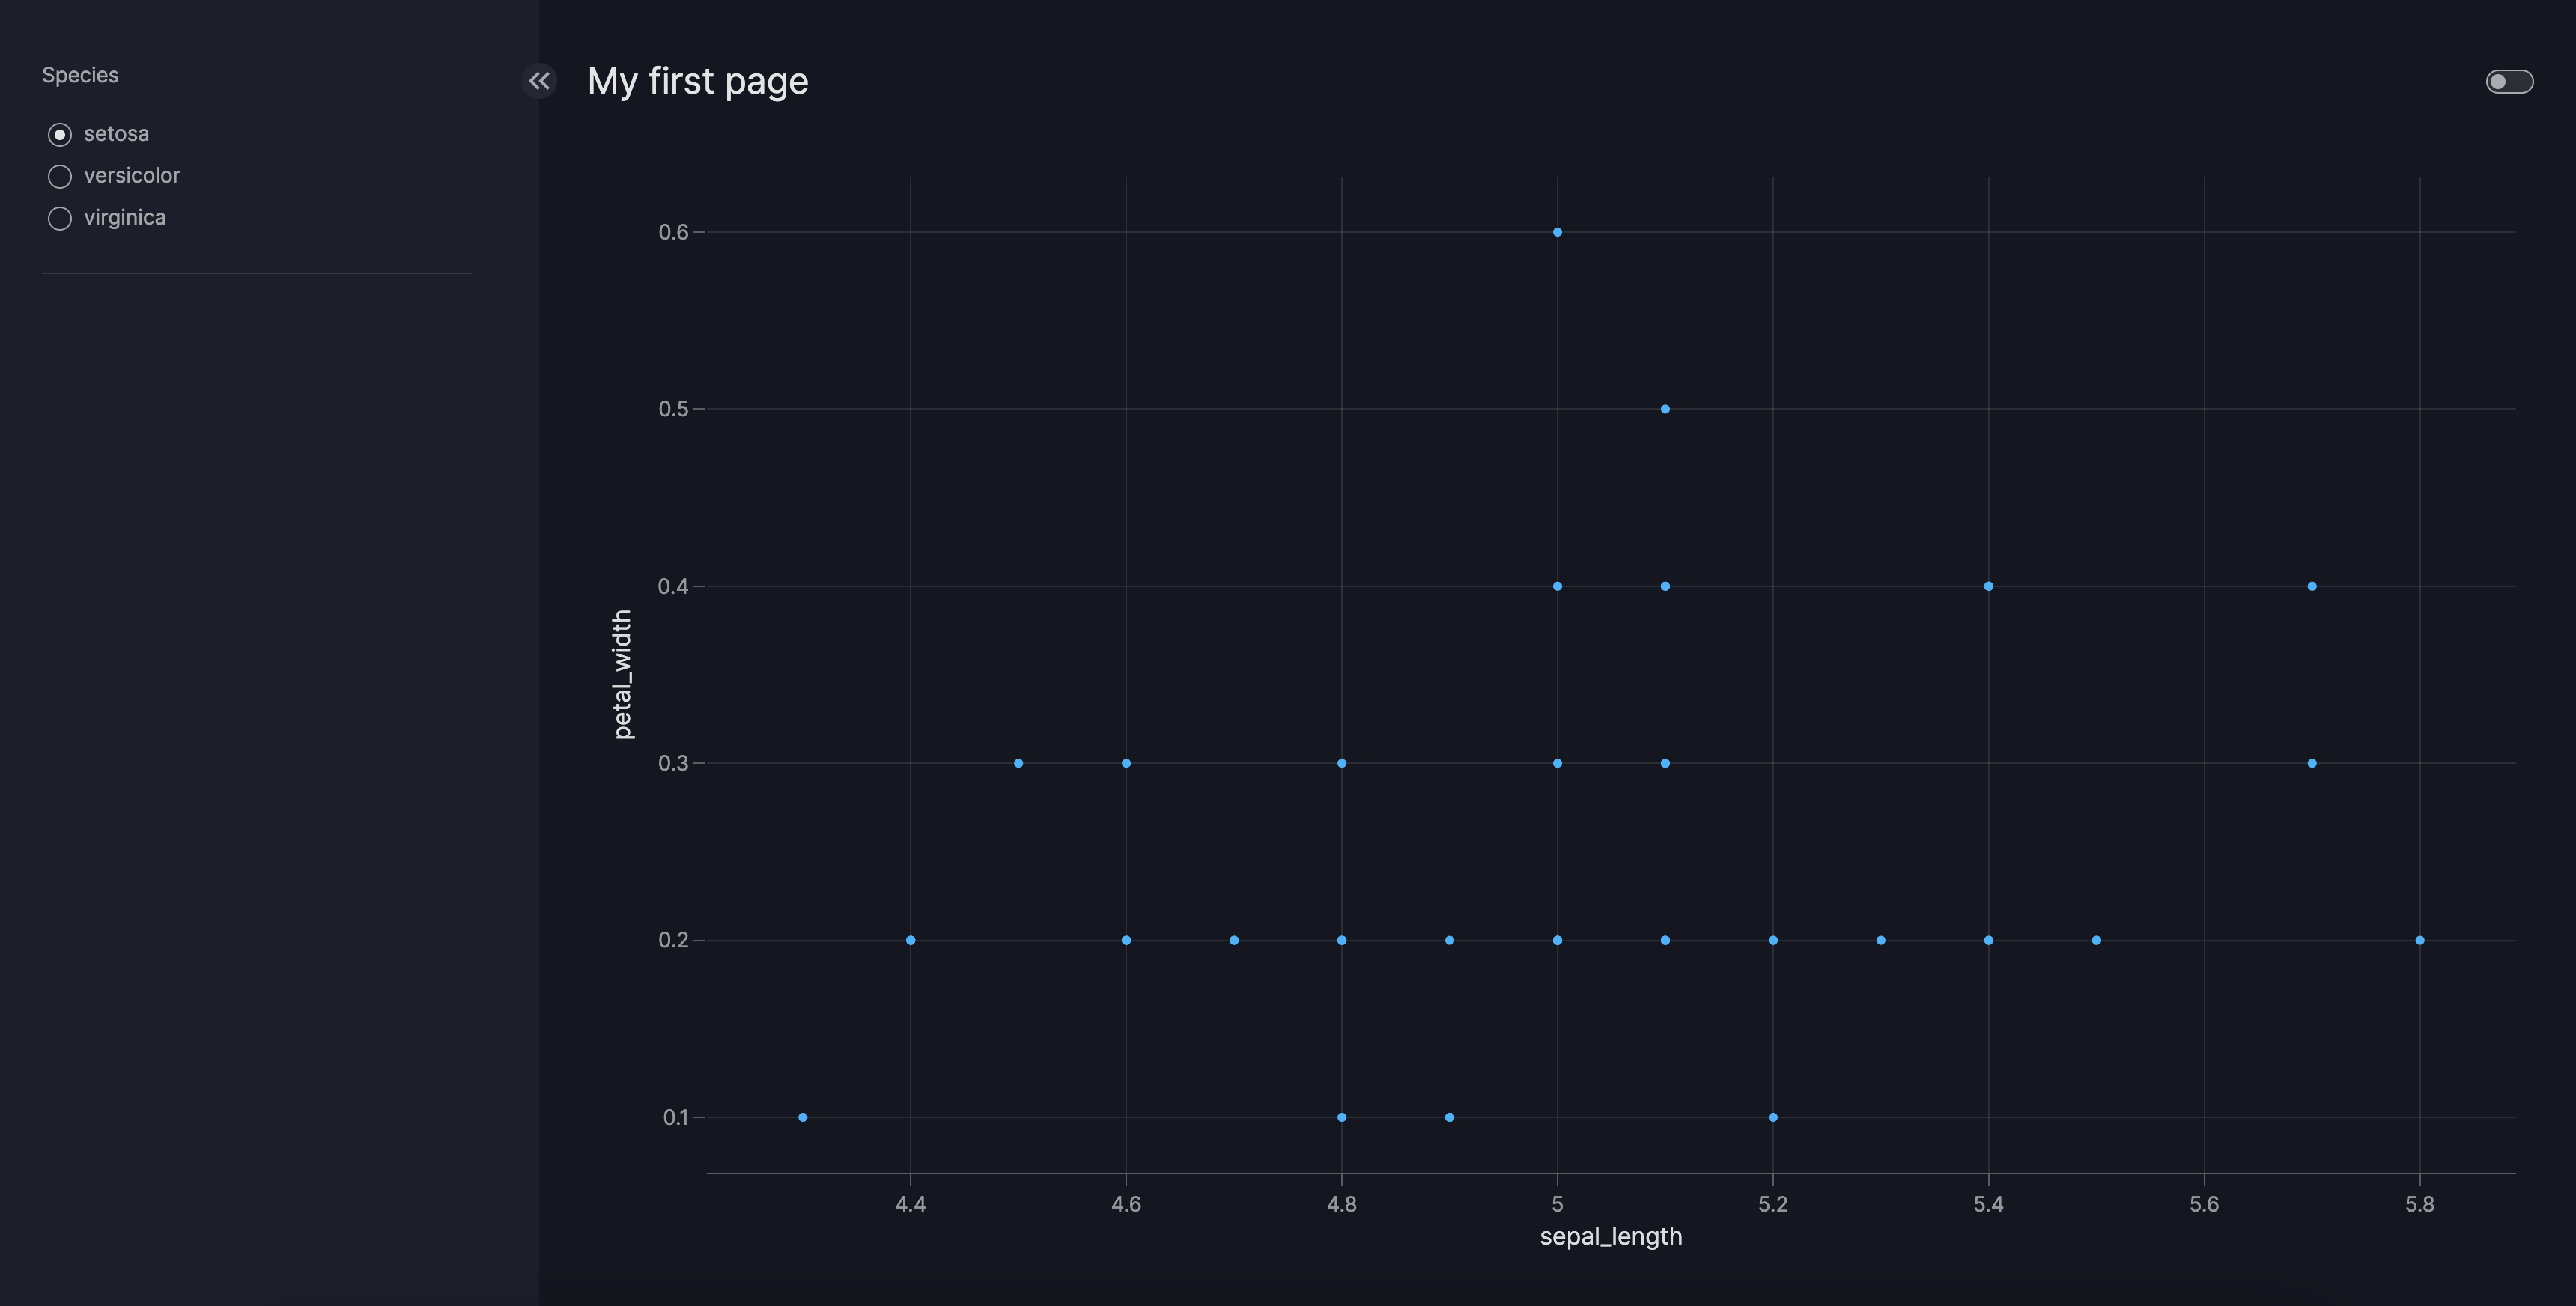
Change selector
Use a different selector argument for the Filter model for a different selector model. For a single column string, available selectors are Checklist, Dropdown, RadioItems, RangeSlider, Slider, DatePicker, TimePicker and Switch. For a hierarchical filter (column as a list), use Cascader as in the section above.
You can explore and test all available selectors interactively on our feature demo dashboard.
Filter with different selector
from vizro import Vizro
import vizro.plotly.express as px
import vizro.models as vm

iris = px.data.iris()

page = vm.Page(
    title="My first page",
    components=[
        vm.Graph(figure=px.scatter(iris, x="sepal_length", y="petal_width")),
    ],
    controls=[
        vm.Filter(column="species", selector=vm.RadioItems()),
    ],
)

dashboard = vm.Dashboard(pages=[page])
Vizro().build(dashboard).run()
![]() Run and edit this code in Py.Cafe
Run and edit this code in Py.Cafe
# Still requires a .py to add data to the data manager and parse YAML configuration
# See yaml_version example
pages:
  - components:
      - figure:
          _target_: scatter
          data_frame: iris
          x: sepal_length
          y: petal_width
        type: graph
    controls:
      - column: species
        selector:
          type: radio_items
        type: filter
    title: My first page
Further customization
For further customizations, refer to the guide to selectors and the Filter model. Some popular choices are:
- Select which components the filter applies to by using
targets. - Customize the
selector, for examplemultito switch between a multi-option and single-option selector,optionsfor a categorical filter orminandmaxfor a numerical filter. - Make the filter's selector invisible by setting
visible=False.
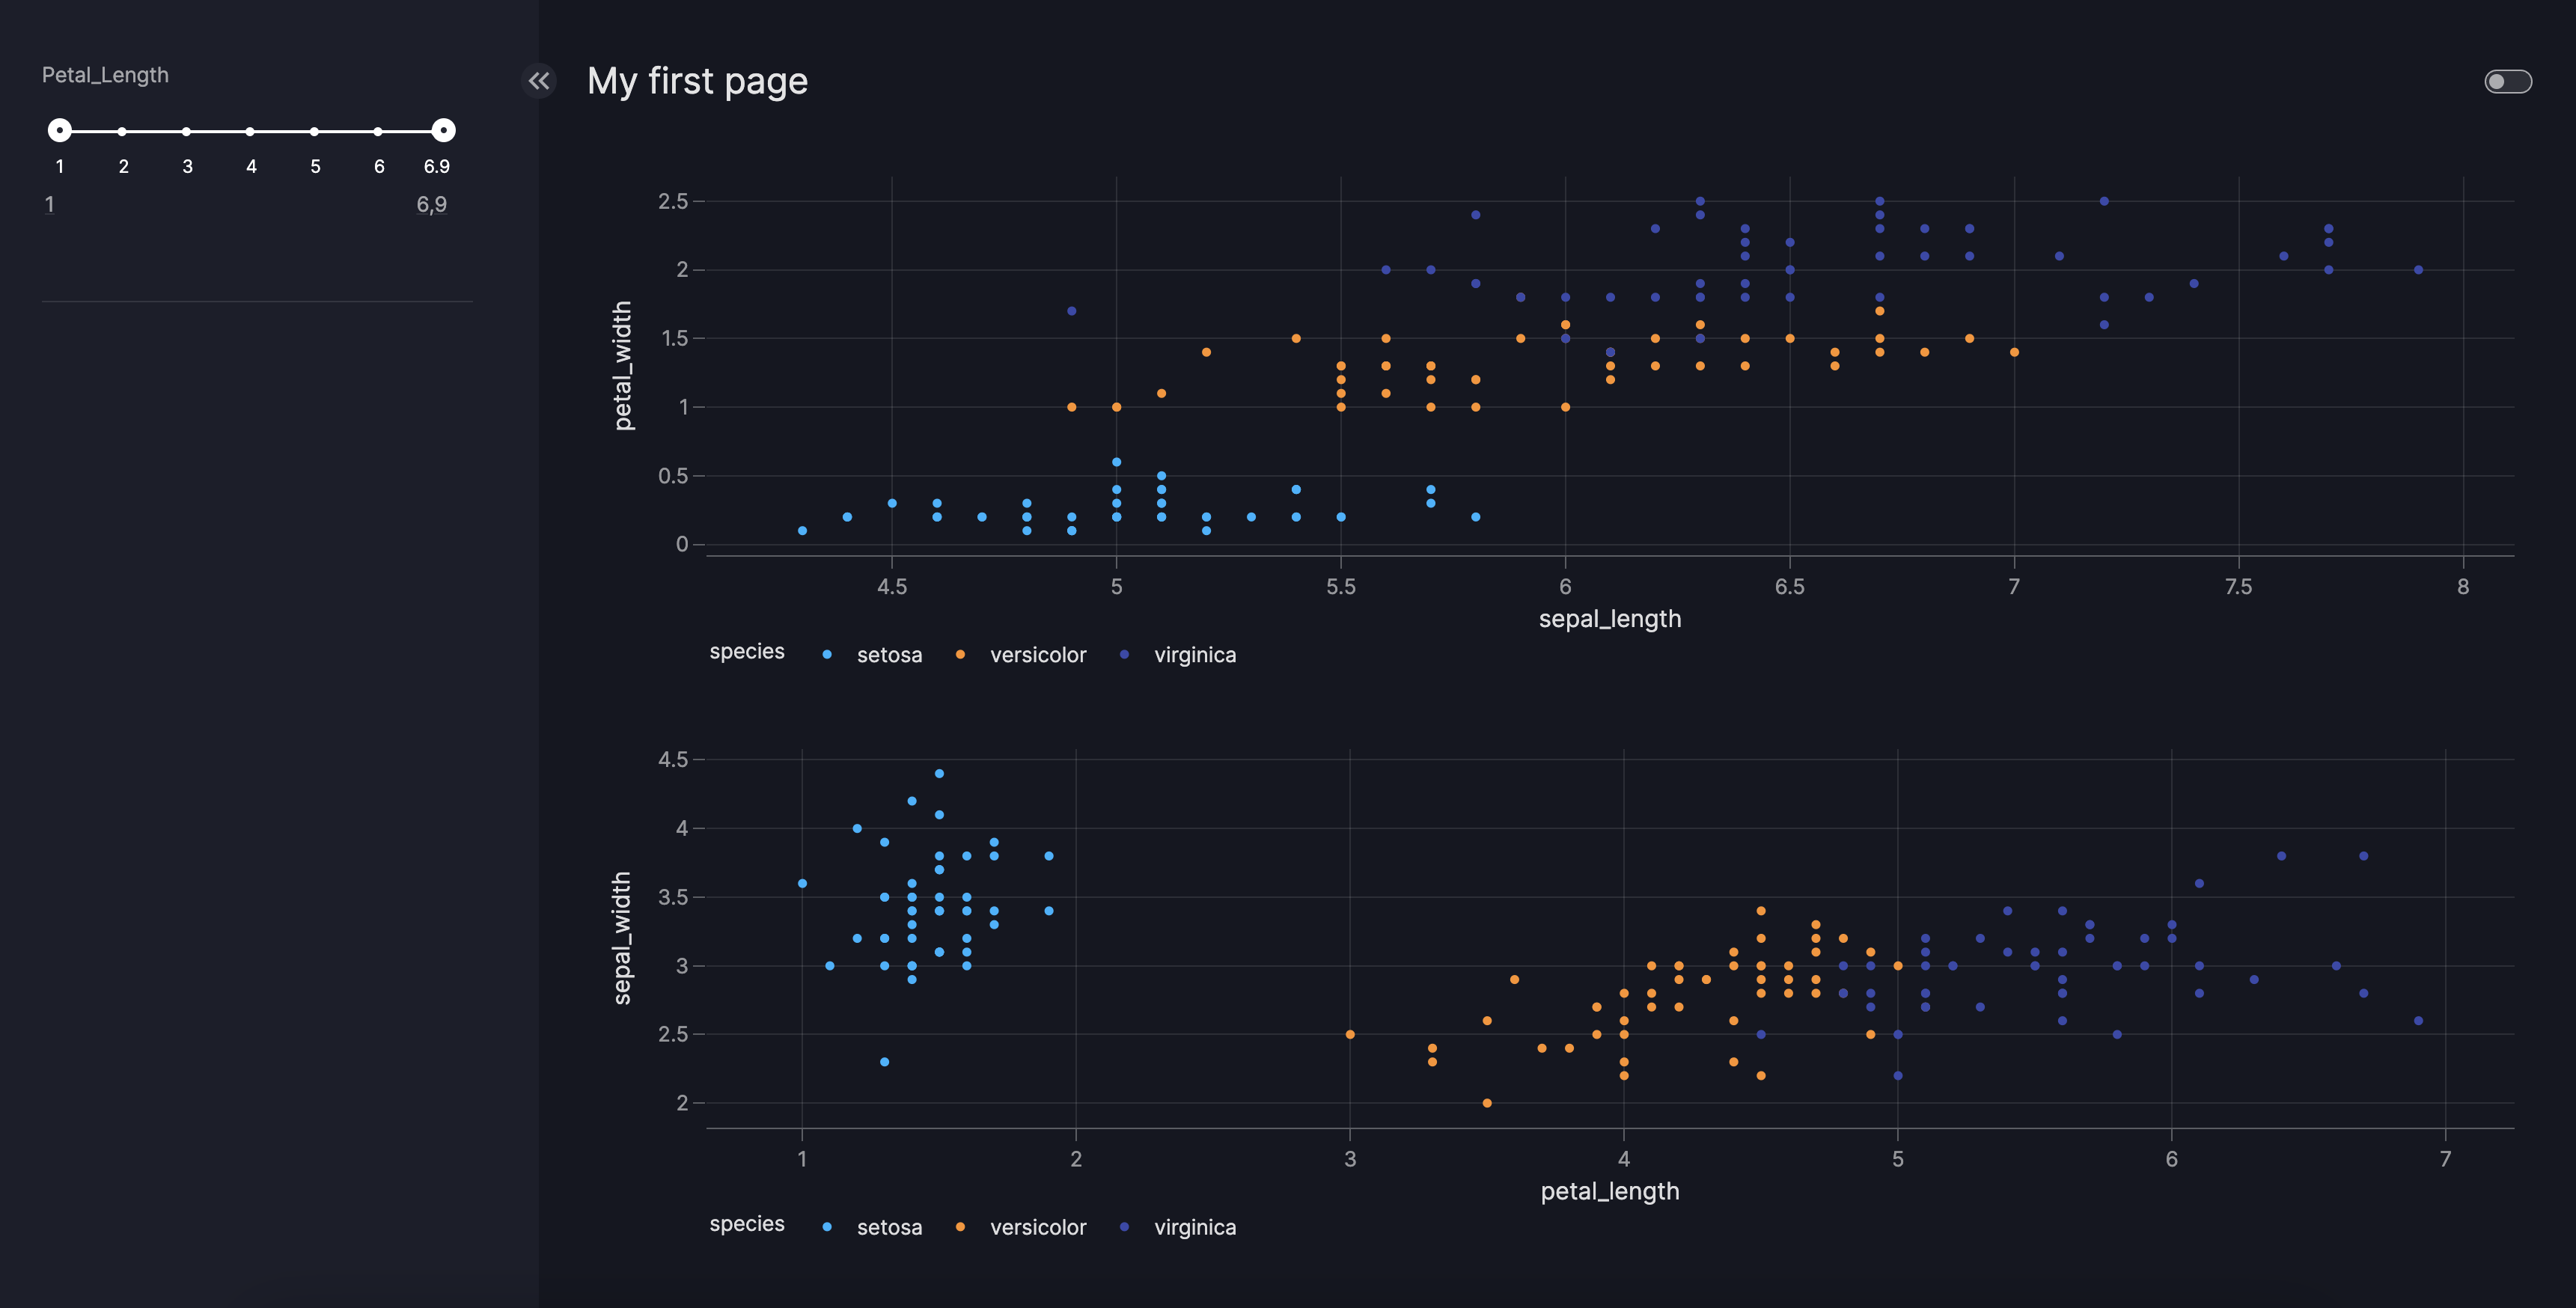
Below is an example where we only target one page component, and where we further customize the chosen selector.
Customized Filter
from vizro import Vizro
import vizro.plotly.express as px
import vizro.models as vm

iris = px.data.iris()

page = vm.Page(
    title="My first page",
    components=[
        vm.Graph(id="scatter_chart", figure=px.scatter(iris, x="sepal_length", y="petal_width", color="species")),
        vm.Graph(figure=px.scatter(iris, x="petal_length", y="sepal_width", color="species")),
    ],
    controls=[
        vm.Filter(column="petal_length",targets=["scatter_chart"], selector=vm.RangeSlider(step=1)),
    ],
)

dashboard = vm.Dashboard(pages=[page])
Vizro().build(dashboard).run()
![]() Run and edit this code in Py.Cafe
Run and edit this code in Py.Cafe
# Still requires a .py to add data to the data manager and parse YAML configuration
# See yaml_version example
pages:
  - components:
      - figure:
          _target_: scatter
          data_frame: iris
          x: sepal_length
          y: petal_width
          color: species
        id: scatter_chart
        type: graph
      - figure:
          _target_: scatter
          data_frame: iris
          x: petal_length
          y: sepal_width
          color: species
        type: graph
    controls:
      - column: petal_length
        targets:
          - scatter_chart
        selector:
          step: 1
          type: range_slider
        type: filter
    title: My first page