How to use tabs
This guide shows you how to use the Tabs model, which organize and separate groups of related content in a dashboard, letting users switch between different sections or views.
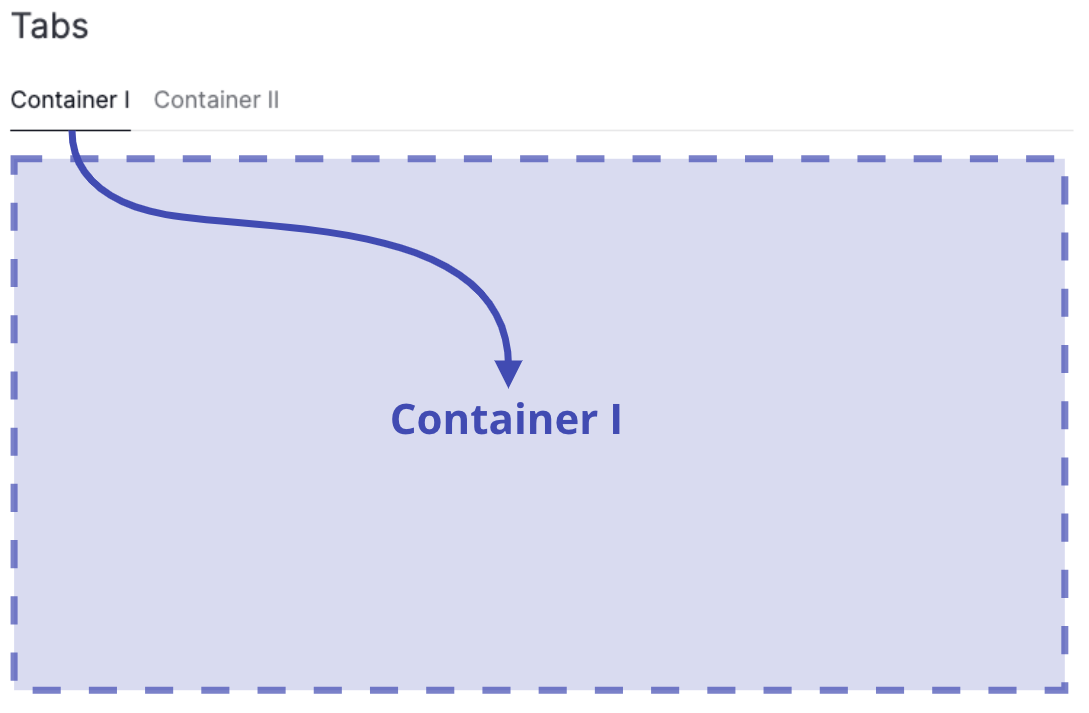
They are essentially a way of putting multiple Container models in the same screen space, and letting the user switch between them. A Container enables the grouping of page components into sections and subsections. The Tabs model is based on the underlying Dash component dbc.Tabs.
Both Tabs and Containers are a more advanced technique for customizing your page layout. If you want to arrange components on a page, we recommend reading our user guide on layouts first.
This guide shows you how to use tabs to organize your Containers into subsections inside the dashboard.
By using the Tabs model, the following applies:
- Filters affect all components on all tabs (opened and closed) of the page if not specified otherwise inside
Filter.targets - The
titleof theContainerinserted intoTabs.tabswill be displayed as a tab label, and the title will be removed from theContainer
Add tabs
To add a Tabs model to your page, do the following:
- Insert the
Tabsmodel into thecomponentsargument of thePagemodel - Insert your
Containermodels into thetabsargument of theTabsmodel - Add a
titleto theContainer, which will be used as thelabelfor the correspondingTab. - (optional) Add a
titleto theTabsmodel to display a heading above yourTabs.
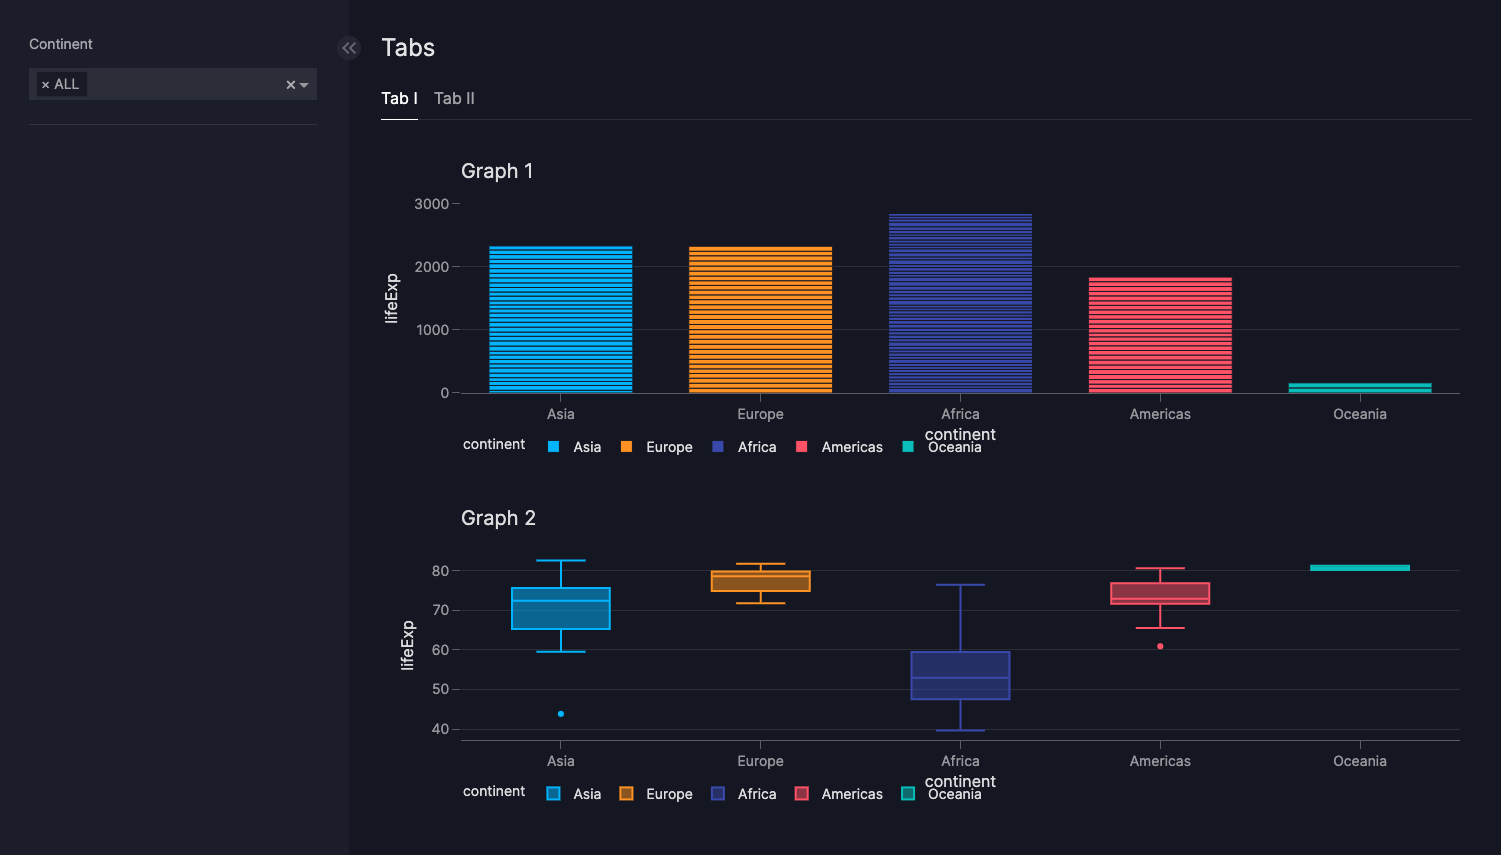
Tabs
import vizro.models as vm
import vizro.plotly.express as px
from vizro import Vizro

gapminder_2007 = px.data.gapminder().query("year == 2007")

page = vm.Page(
    title="Tabs",
    components=[
        vm.Tabs(
            title="Tabs Title",
            tabs=[
                vm.Container(
                    title="Tab I",
                    components=[
                        vm.Graph(
                            figure=px.bar(
                                gapminder_2007,
                                title="Graph 1",
                                x="continent",
                                y="lifeExp",
                                color="continent",
                            ),
                        ),
                        vm.Graph(
                            figure=px.box(
                                gapminder_2007,
                                title="Graph 2",
                                x="continent",
                                y="lifeExp",
                                color="continent",
                            ),
                        ),
                    ],
                ),
                vm.Container(
                    title="Tab II",
                    components=[
                        vm.Graph(
                            figure=px.scatter(
                                gapminder_2007,
                                title="Graph 3",
                                x="gdpPercap",
                                y="lifeExp",
                                size="pop",
                                color="continent",
                            ),
                        ),
                    ],
                ),
            ],
        ),
    ],
)

dashboard = vm.Dashboard(pages=[page])
Vizro().build(dashboard).run()
![]() Run and edit this code in Py.Cafe
Run and edit this code in Py.Cafe
# Still requires a .py to add data to the data manager and parse YAML configuration
# See yaml_version example
pages:
  components:
    - type: tabs
      title: Tabs Title
      tabs:
        - title: Tab I
          type: container
          components:
            - type: graph
              figure:
                _target_: bar
                data_frame: gapminder_2007
                title: Graph 1
                x: continent
                y: lifeExp
                color: continent
            - type: graph
              figure:
                _target_: box
                data_frame: gapminder_2007
                title: Graph 2
                x: continent
                y: lifeExp
                color: continent
        - title: Tab II
          type: container
          components:
            - type: graph
              figure:
                _target_: scatter
                data_frame: gapminder_2007
                title: Graph 3
                x: gdpPercap
                y: lifeExp
                size: pop
                color: continent
  title: Tabs
Add a tooltip
The description argument enables you to add helpful context to your tabs by displaying an info icon next to its title. Hovering over the icon shows a tooltip with your chosen text.
You can provide Markdown text as a string to use the default info icon or a Tooltip model to use any icon from the Google Material Icons library.
Tabs with tooltip
import vizro.models as vm
import vizro.plotly.express as px
from vizro import Vizro

gapminder_2007 = px.data.gapminder().query("year == 2007")

page = vm.Page(
    title="Tabs",
    components=[
        vm.Tabs(
            title="Tabs Title",
            description="""
                The Iris dataset includes measurements of 150 iris flowers across three types: Setosa, Versicolor, and Virginica.

                While all samples are labeled by type, they can appear similar when looking at just some features—making it a useful dataset for exploring patterns and challenges in classification.
            """,
            tabs=[
                vm.Container(
                    title="Tab I",
                    components=[
                        vm.Graph(
                            figure=px.bar(
                                gapminder_2007,
                                title="Graph 1",
                                x="continent",
                                y="lifeExp",
                                color="continent",
                            ),
                        ),
                        vm.Graph(
                            figure=px.box(
                                gapminder_2007,
                                title="Graph 2",
                                x="continent",
                                y="lifeExp",
                                color="continent",
                            ),
                        ),
                    ],
                ),
                vm.Container(
                    title="Tab II",
                    components=[
                        vm.Graph(
                            figure=px.scatter(
                                gapminder_2007,
                                title="Graph 3",
                                x="gdpPercap",
                                y="lifeExp",
                                size="pop",
                                color="continent",
                            ),
                        ),
                    ],
                ),
            ],
        ),
    ],
)

dashboard = vm.Dashboard(pages=[page])
Vizro().build(dashboard).run()
![]() Run and edit this code in Py.Cafe
Run and edit this code in Py.Cafe
# Still requires a .py to add data to the data manager and parse YAML configuration
# See yaml_version example
pages:
  components:
    - type: tabs
      title: Tabs Title
      description: |
            The Iris dataset includes measurements of 150 iris flowers across three types: Setosa, Versicolor, and Virginica.

            While all samples are labeled by type, they can appear similar when looking at just some features—making it a useful dataset for exploring patterns and challenges in classification.
      tabs:
        - title: Tab I
          type: container
          components:
            - type: graph
              figure:
                _target_: bar
                data_frame: gapminder_2007
                title: Graph 1
                x: continent
                y: lifeExp
                color: continent
            - type: graph
              figure:
                _target_: box
                data_frame: gapminder_2007
                title: Graph 2
                x: continent
                y: lifeExp
                color: continent
        - title: Tab II
          type: container
          components:
            - type: graph
              figure:
                _target_: scatter
                data_frame: gapminder_2007
                title: Graph 3
                x: gdpPercap
                y: lifeExp
                size: pop
                color: continent
  title: Tabs
![]()