How to use actions
Actions control how your app responds to user input such as clicking a button or a point on a graph. If an action is not built into Vizro then you can write your own custom action. In these guides we show how to use built-in actions across a range of areas:
- Handle data, for example to export data.
- Graph and table interactions, for example to cross-filter.
- Show notifications, for example to provide user feedback.
A complete list of built-in actions in given in the API documentation. We also have an in-depth tutorial on writing your own action and an explanation of how Vizro actions work.
Note
Do you have an idea for a built-in action? Submit a feature request!
General principles
Many Vizro models have an actions argument that can contain one or more actions. Each action is a Python function that is triggered by a user interaction.
To use an action:
- add
import vizro.actions as vato your imports - call the relevant action in the
actionsargument of the model that triggers the action
You can also execute multiple actions with a single trigger.
Some actions are typically triggered by certain components, for example export_data is usually triggered by clicking a button. However, many actions can be triggered by any component, for example:
- you can trigger a chart and filter interaction by clicking on a
card. There's an illustration of this in the trigger an action with a card example.
Note
Unlike custom actions, built-in actions do not use the Action model.
Trigger an action with a button
Here is an example action that uses the export_data action when a button is clicked.
Action triggered by button
import vizro.actions as va
import vizro.models as vm
import vizro.plotly.express as px
from vizro import Vizro

df = px.data.iris()

page = vm.Page(
    title="Action triggered by a button",
    components=[
        vm.Graph(figure=px.histogram(df, x="sepal_length")),
        vm.Button(text="Export data", actions=va.export_data()),
    ],
    controls=[vm.Filter(column="species")],
)

dashboard = vm.Dashboard(pages=[page])
Vizro().build(dashboard).run()
![]() Run and edit this code in Py.Cafe
Run and edit this code in Py.Cafe
# Still requires a .py to add data to the data manager and parse YAML configuration
# See yaml_version example
pages:
  - components:
      - type: graph
        figure:
          _target_: histogram
          x: sepal_length
      - type: button
        text: Export data
        actions:
          - type: export_data
  - controls:
      - type: filter
        column: species
    layout:
      type: flex
    title: Action triggered by a button
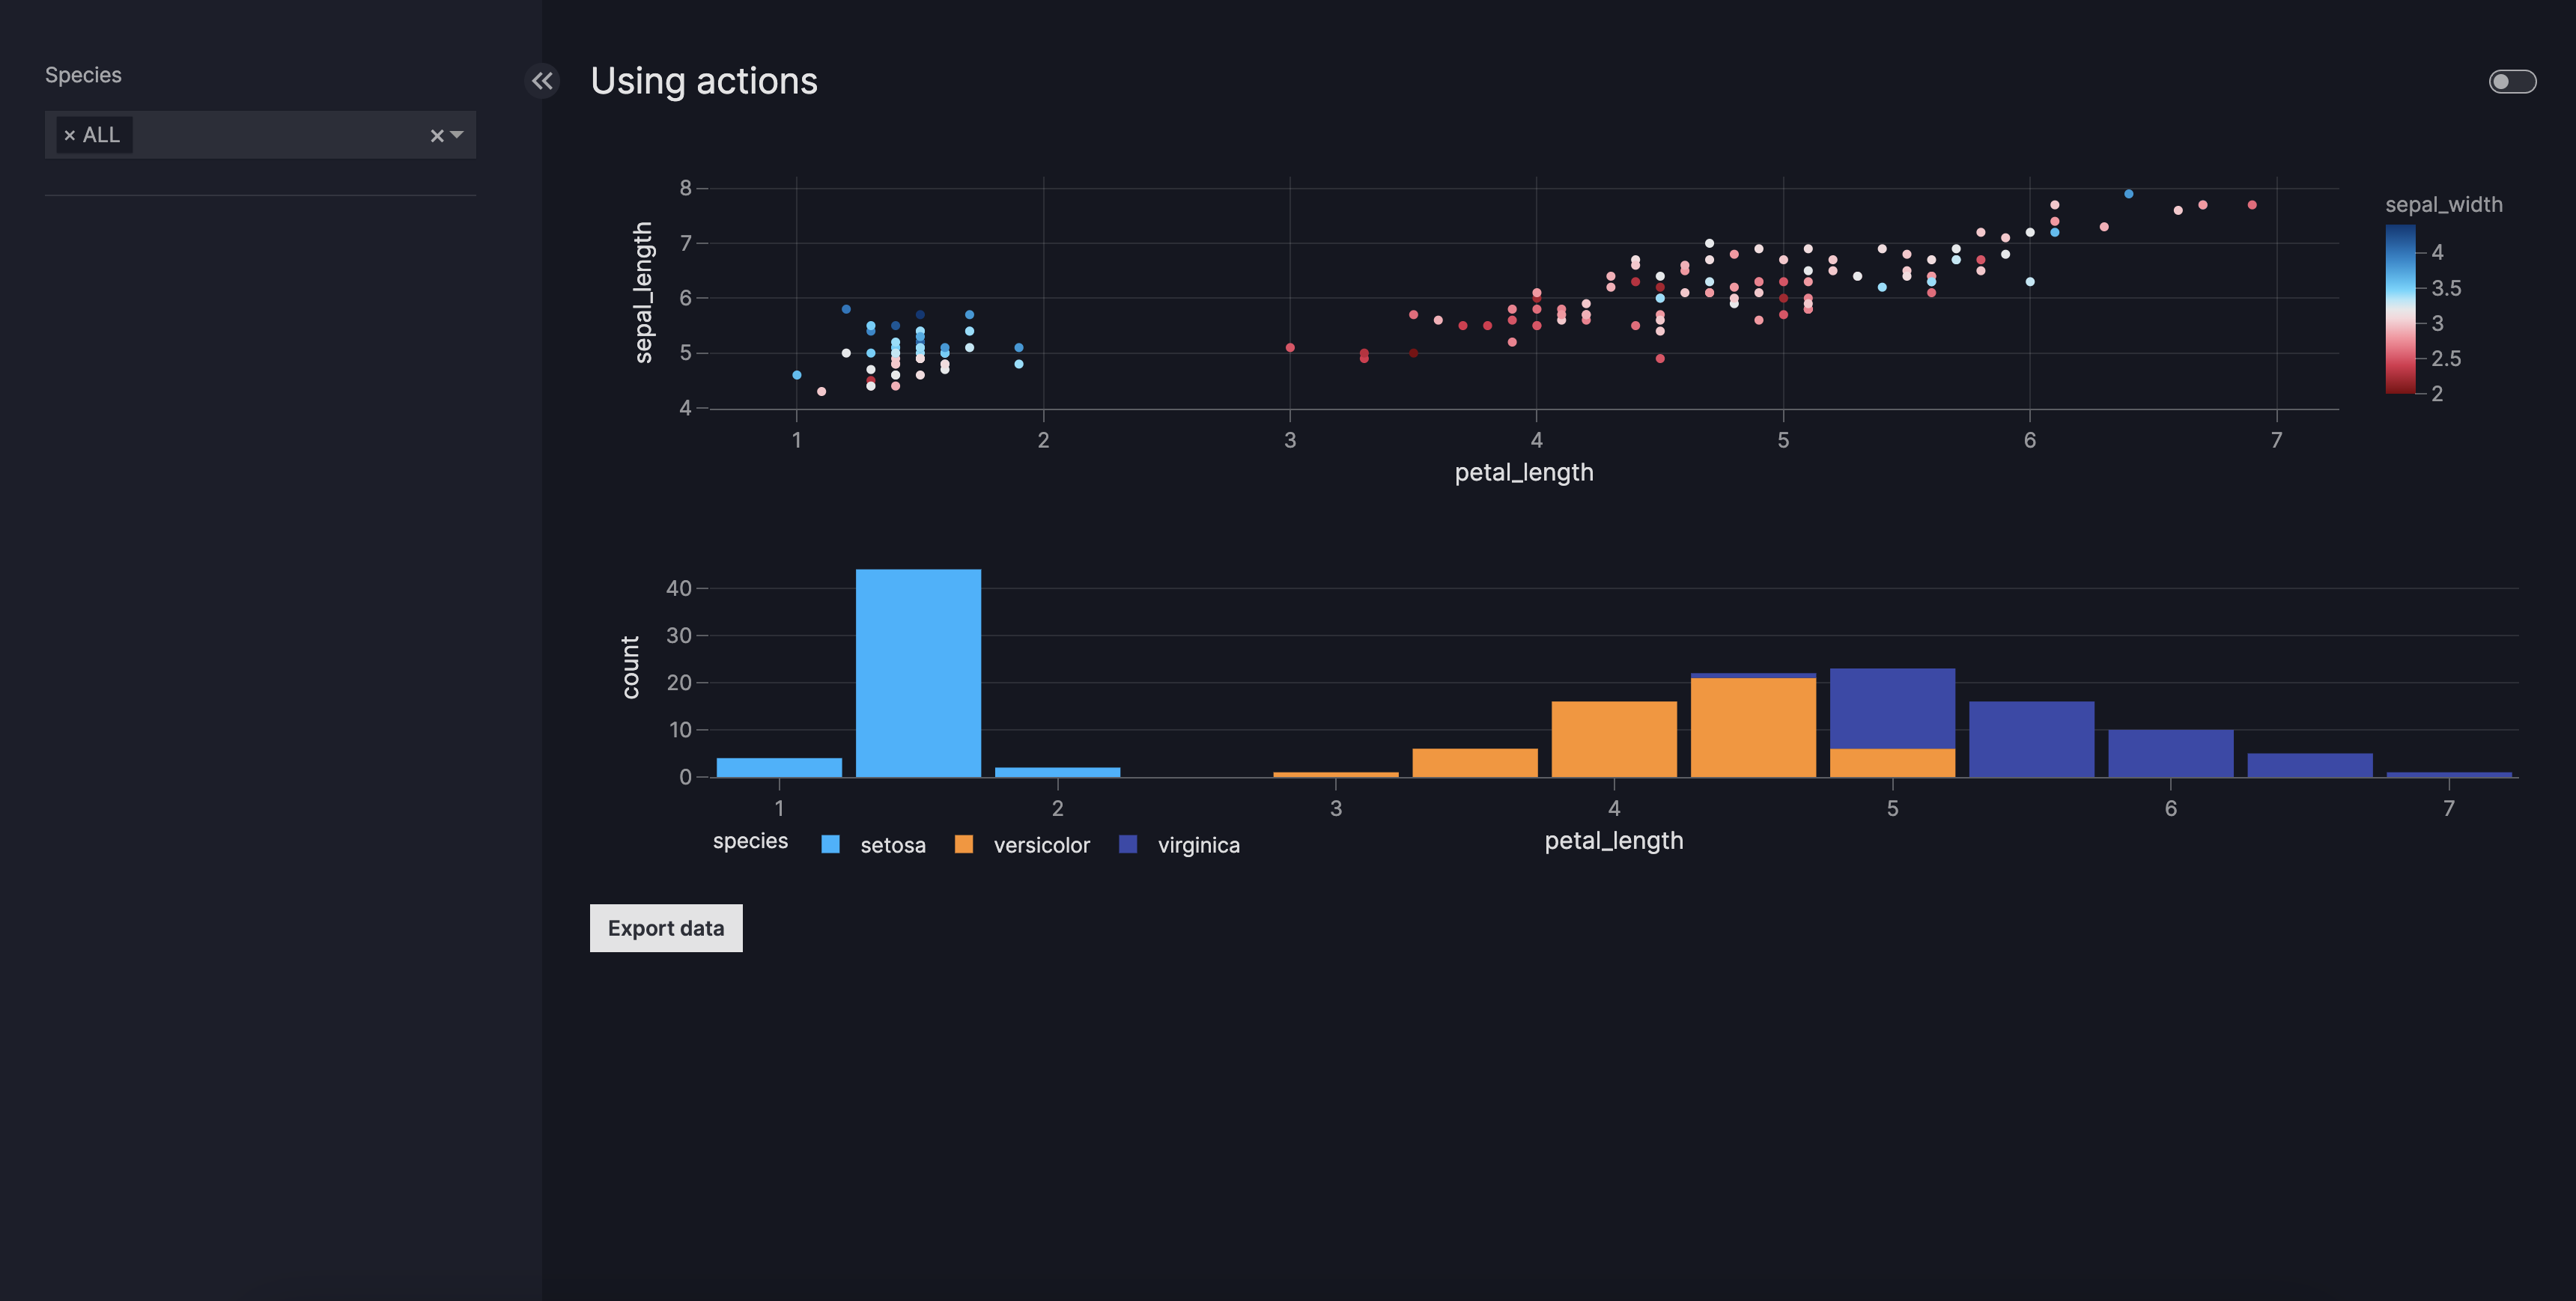
When you click the "Export data" button, the data for all graphs, tables and figures on the page is downloaded. In this example, this will produce a csv file for the graph's source data px.data.iris().
Tip
If you have many buttons that trigger actions then you might like to give them icons. You can even have icon-only buttons with no text.
Trigger an action with a graph
Here is an example that performs a cross-filter between a graph and a table. When you click on a box in the graph, the table is cross-filtered to show data for only one sex.
Cross-filter from graph to table
import vizro.actions as va
import vizro.models as vm
import vizro.plotly.express as px
from vizro import Vizro
from vizro.tables import dash_ag_grid

tips = px.data.tips()

page = vm.Page(
    title="Cross-filter from graph to table",
    components=[
        vm.Graph(
            title="Click on a box to use that box's sex to filter table",
            figure=px.box(tips, x="tip", y="sex"),
            actions=va.set_control(control="sex_filter", value="y"),
        ),
        vm.AgGrid(id="tips_table", figure=dash_ag_grid(tips)),  # (1)!
    ],
    controls=[vm.Filter(id="sex_filter", column="sex", targets=["tips_table"])],  # (2)!
)

dashboard = vm.Dashboard(pages=[page])
Vizro().build(dashboard).run()
![]() Run and edit this code in Py.Cafe
Run and edit this code in Py.Cafe
- We give the
vm.AgGridanidso that it can be targeted explicitly byvm.Filter(id="sex_filter"). - We give the
vm.Filteranidso that it can be set explicitly byva.set_control.
# Still requires a .py to add data to the data manager and parse YAML configuration
# See yaml_version example
pages:
  - components:
      - actions:
          - control: sex_filter
            type: set_control
            value: y
        figure:
          _target_: box
          data_frame: tips
          x: tip
          y: sex
        title: Click on a box to use that box's sex to filter table
        type: graph
      - figure:
          _target_: dash_ag_grid
          data_frame: tips
        id: tips_table
        type: ag_grid
    controls:
      - column: sex
        id: sex_filter
        targets:
          - tips_table
        type: filter
    title: Cross-filter from graph to table

Multiple actions
When you specify multiple actions as actions=[action_1, action_2, ...] then Vizro chains these actions in order, so that action_2 executes only when action_1 has completed. You can freely mix built-in actions and custom actions in an actions chain. For more details on how actions chains execute, see our tutorial on custom actions.
Here is an example actions chain that uses a custom action_function action and the built-in export_data action: