How to use pages
This guide shows you how to add pages to your dashboard and customize the URL paths if needed.
A Page lets you place and arrange your dashboard content (for example, chart/components, tables, and text)
and configure your dashboard interactions (such as filters and parameters).
The Dashboard model accepts the pages argument, where you can insert your Page.
Create a page
A Page is split up into four main containers:
- The navigation container where you can customize your
navigation(see Dashboard and Navigation for more information) - The control container where you can add your
controls(see Filters or Parameters) to interact with the dashboard - The page header that contains the page title and the theme toggle switch button
- The component container where you can add your components to visualize your data
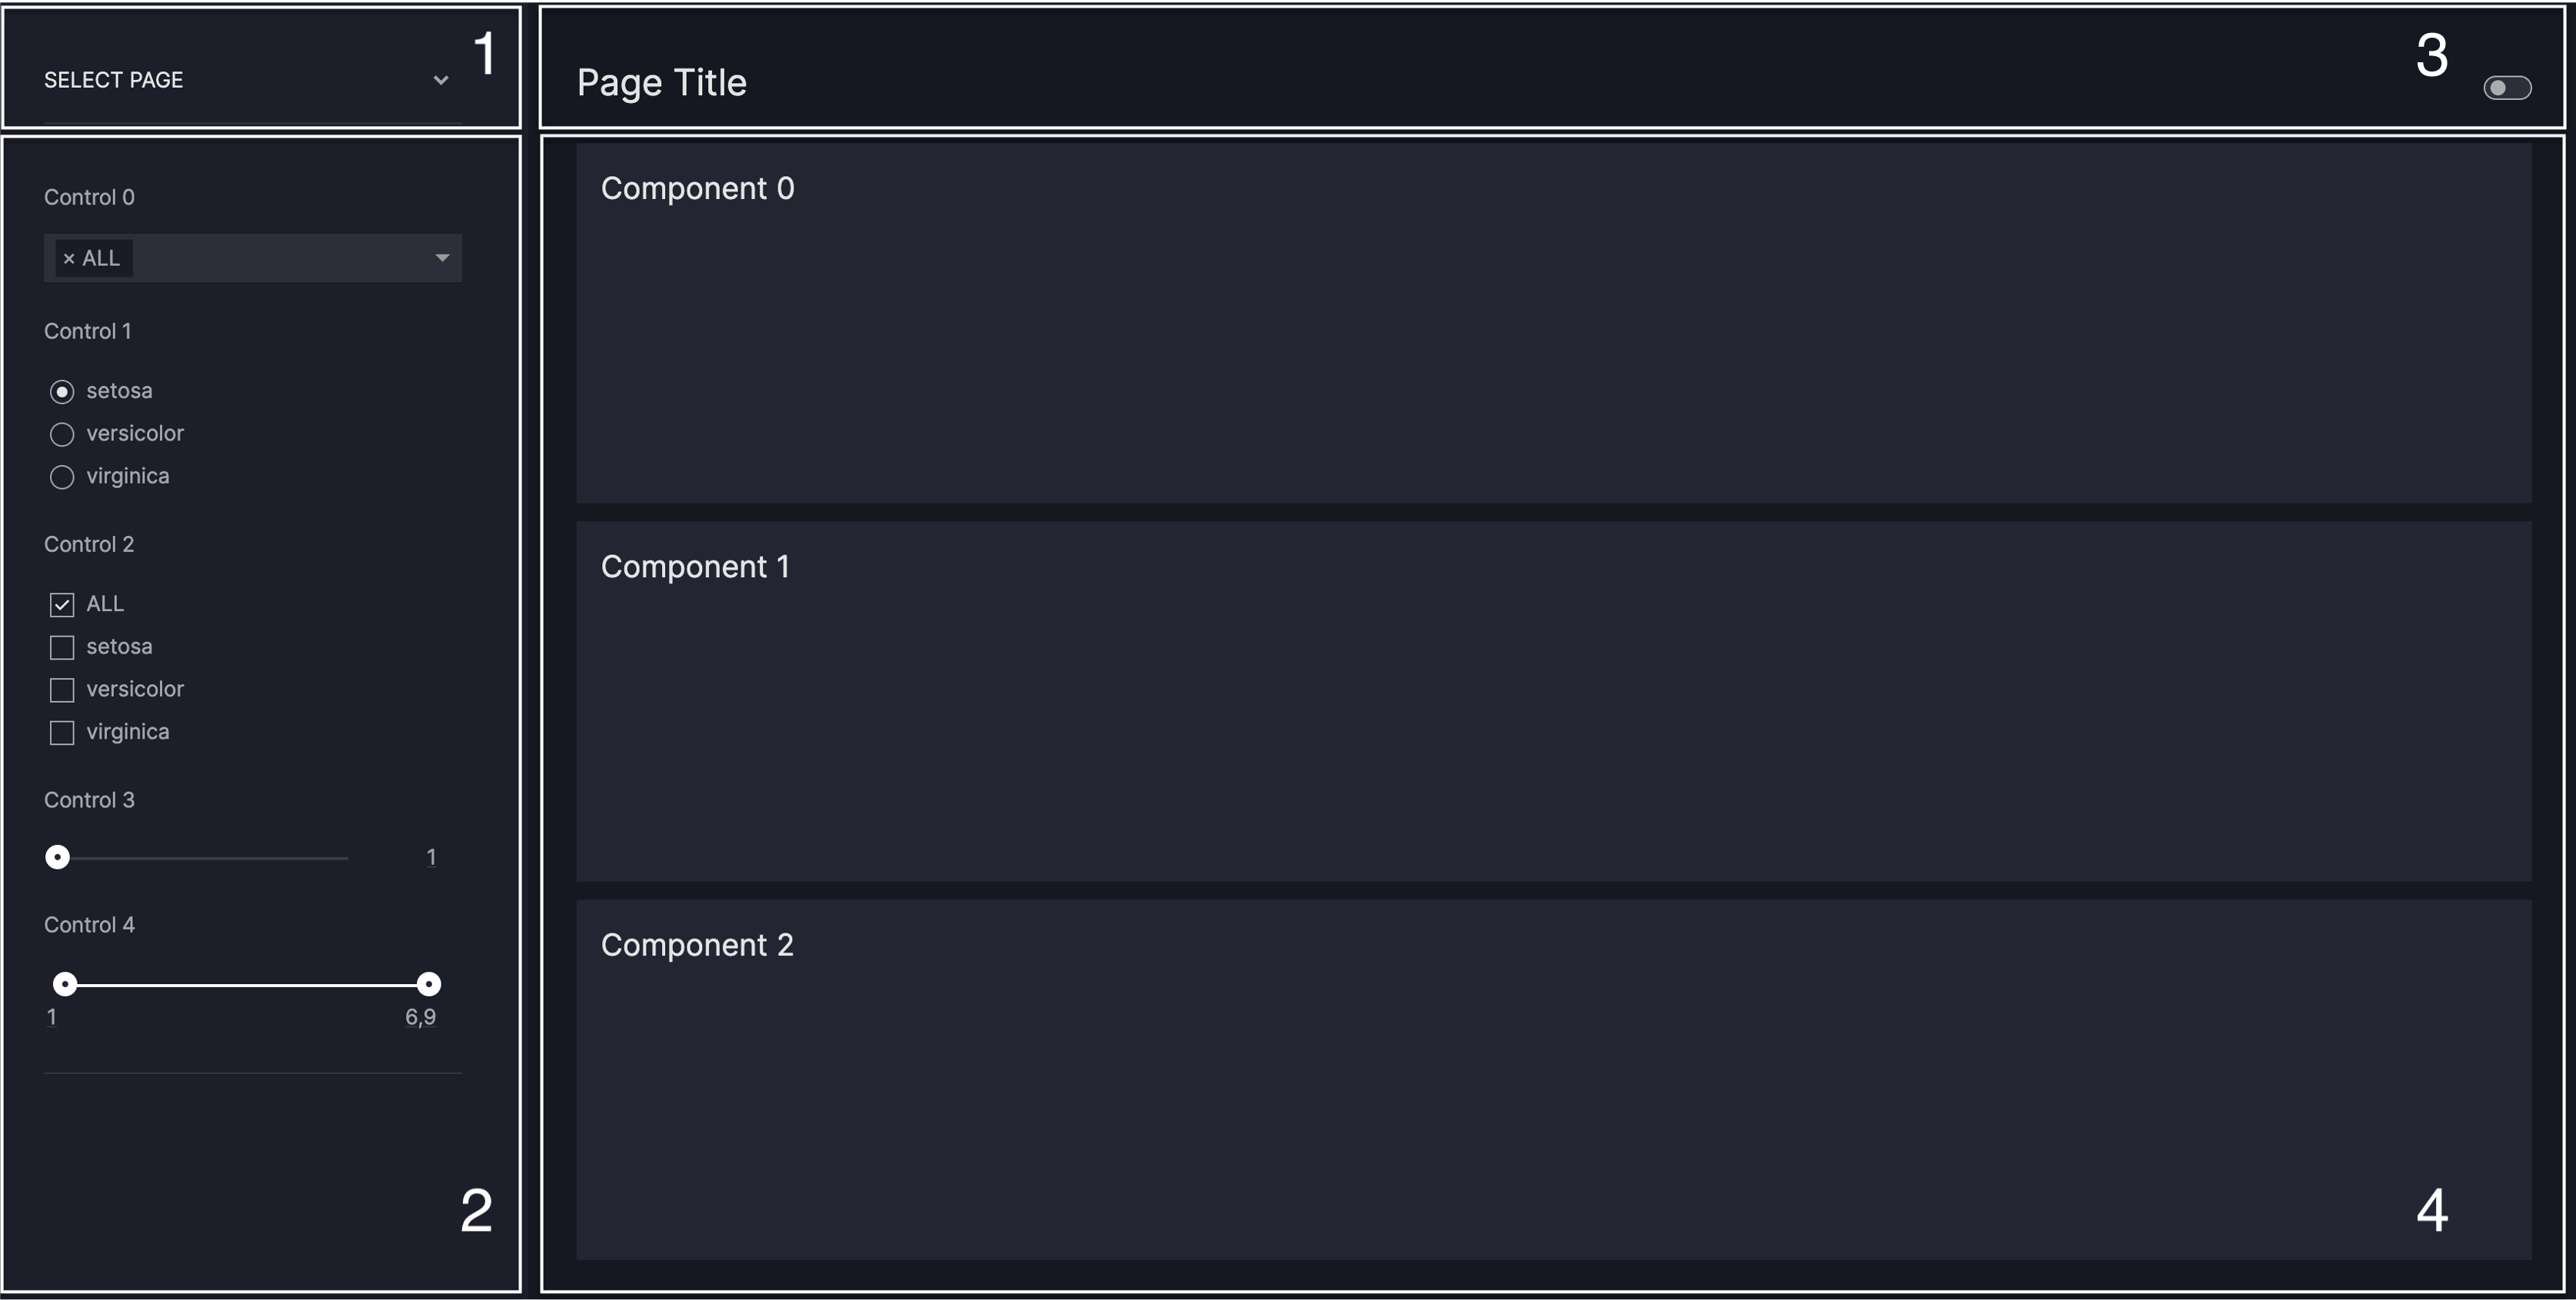
Note
Note that the navigation container needs to be configured via the Dashboard.
To create and add a page to your dashboard, do the following steps:
- Set a
titlefor yourPage - Configure your
components, see our guide on the various options - (optional) Configure your
controls, see our guides on Filters and Parameters - (optional) Configure your
layout, see our guide on Layouts - (optional) Give a
descriptionof yourPageto the app's meta tags
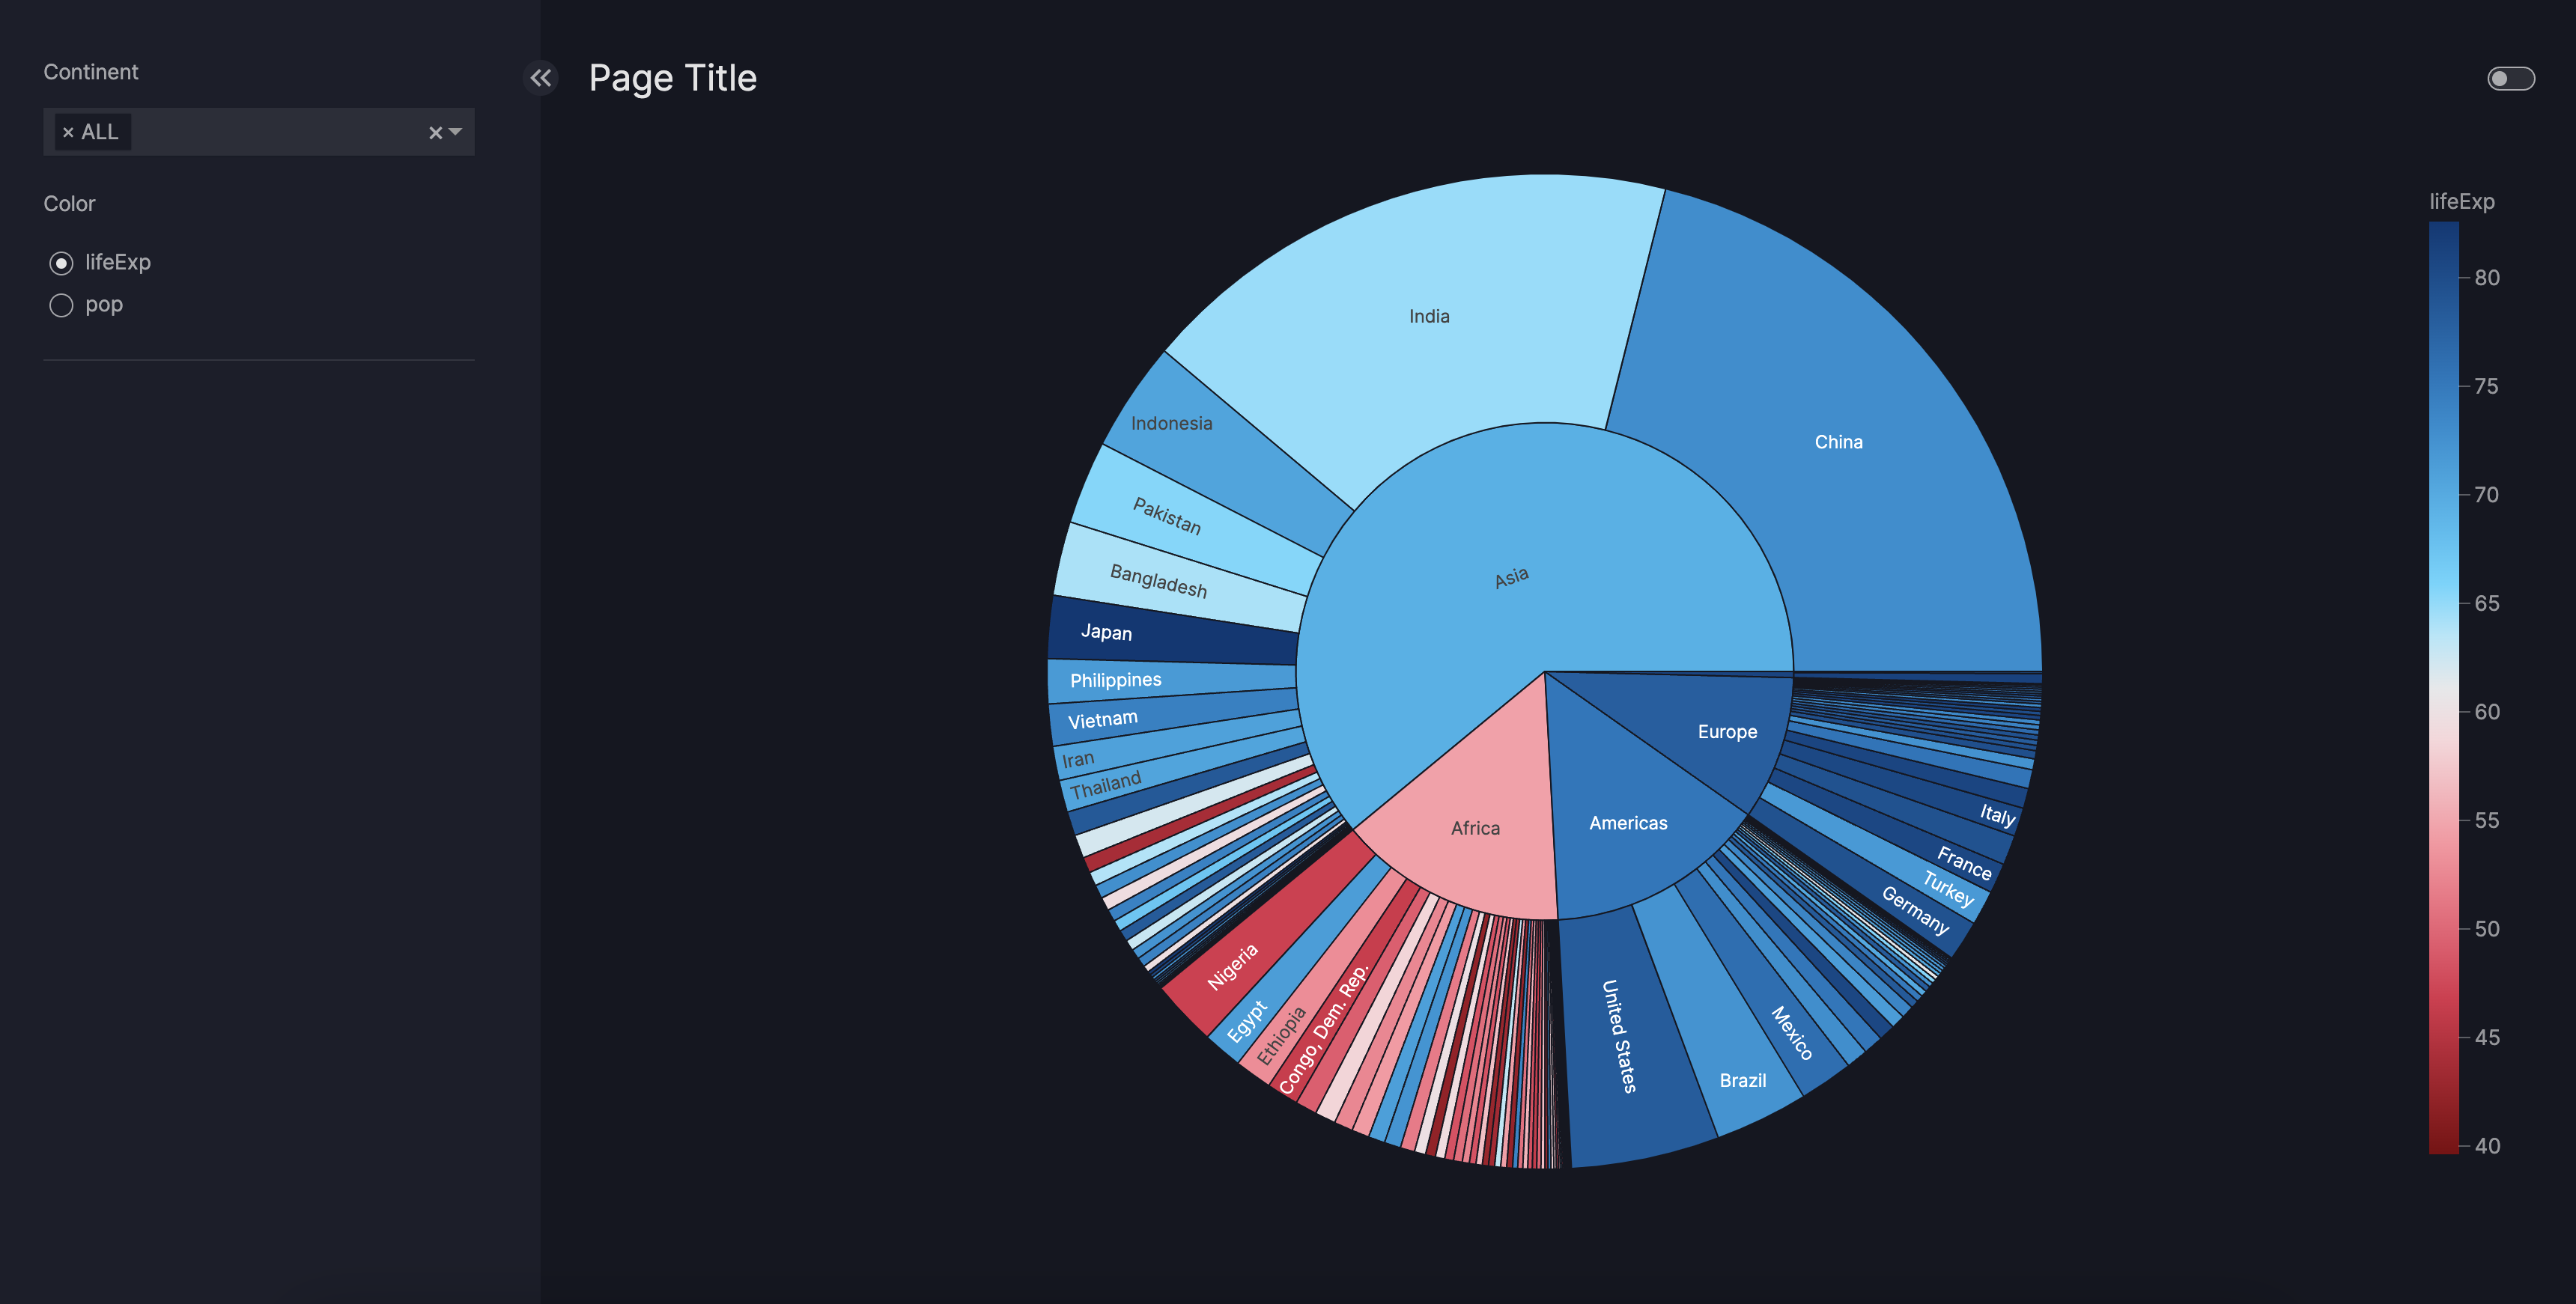
Page
import vizro.models as vm
import vizro.plotly.express as px
from vizro import Vizro

gapminder = px.data.gapminder().query("year == 2007")

page = vm.Page(
    title="Page Title",
    description="Longer description of the page content",
    components=[
        vm.Graph(
            id="sunburst", figure=px.sunburst(gapminder, path=["continent", "country"], values="pop", color="lifeExp")
        )
    ],
    controls=[
        vm.Filter(column="continent", targets=["sunburst"]),
        vm.Parameter(targets=["sunburst.color"], selector=vm.RadioItems(options=["lifeExp", "pop"], title="Color")),
    ],
)

dashboard = vm.Dashboard(pages=[page])

Vizro().build(dashboard).run()
# Still requires a .py to add data to the data manager and parse YAML configuration
# See yaml_version example
pages:
- components:
    - figure:
        _target_: sunburst
        path: ['continent', 'country']
        values: pop
        color: lifeExp
        data_frame: gapminder
      id: sunburst
      type: graph
  controls:
    - column: continent
      targets:
        - sunburst
      type: filter
    - selector:
        options: ['lifeExp', 'pop']
        title: Color
        type: radio_items
    targets:
      - sunburst.color
    type: parameter
  title: Page Title
  description: "Longer description of the page content"
Note
Note that an accordion page selector is automatically added to your dashboard in the top-left of the control container. This accordion allows navigating through the different pages.
The accordion page selector will not be added if your dashboard consists of only one page.
You can additionally navigate through the different pages by going directly to the relevant page URL (more details in next section).
Customize the page URL
By default, the page URL is automatically generated based on the id of the page. For example, if id="This is my first page"
the generated page URL will be path=this-is-my-first-page. You can then access the page via localhost:<port_number>/this-is-my-first-page.
Note that the page id defaults to be the same as the page title if not set.
If you have multiple pages with the same title then you must assign a unique id.
The first page always has the URL prefix / assigned. A custom URL can, therefore, not be created for the first page.
To customize the page URL, pass a valid URL name to the path argument of Page:
Page
import vizro.models as vm
import vizro.plotly.express as px
from vizro import Vizro

gapminder = px.data.gapminder().query("year == 2007")

page1 = vm.Page(
    title="Page 1",
    components=[
        vm.Card(
            text="""Commodi repudiandae consequuntur voluptatum.""",
        ),
    ],
)

page2 = vm.Page(
    title="Page 2",
    path="my-custom-url",
    components=[
        vm.Graph(
            id="sunburst", figure=px.sunburst(gapminder, path=["continent", "country"], values="pop", color="lifeExp")
        )
    ],
    controls=[
        vm.Filter(column="continent", targets=["sunburst"]),
        vm.Parameter(targets=["sunburst.color"], selector=vm.RadioItems(options=["lifeExp", "pop"], title="Color")),
    ],
)

dashboard = vm.Dashboard(pages=[page1, page2])

Vizro().build(dashboard).run()
# Still requires a .py to add data to the data manager and parse YAML configuration
# See yaml_version example
pages:
- components:
    - text: |
        Commodi repudiandae consequuntur voluptatum.
      type: card
  title: Page 1
- components:
    - figure:
        _target_: sunburst
        path: ['continent', 'country']
        values: pop
        color: lifeExp
        data_frame: gapminder
      id: sunburst
      type: graph
  controls:
    - column: continent
      targets:
        - sunburst
      type: filter
    - selector:
        options: ['lifeExp', 'pop']
        title: Color
        type: radio_items
    targets:
      - sunburst.color
    type: parameter
  title: Page 2
  path: my-custom-url
You can now access the first page via localhost:<port_number>/ and the second page via localhost:<port_number>/my-custom-url.