Skip to content

How to use navigation

This guide shows you how to use and customize the navigation that appears on the left of your dashboard.

The Dashboard model accepts a navigation argument, where you can enter a Navigation model. This enables you to group pages together and customize how they appear in your navigation. The dashboard includes a collapsible side panel that users can minimize or expand by a button click. The collapse button, located in the top right corner of the side panel, is visible by default for user convenience.

Use the default navigation

By default, if the navigation argument is not specified, Vizro creates a navigation panel which lists all the pages in your dashboard into a collapsible accordion menu with title SELECT PAGE.

Default navigation

from vizro import Vizro
import vizro.plotly.express as px
import vizro.models as vm

iris = px.data.iris()

page_1 = vm.Page(
    title="My first page",
    components=[
        vm.Graph(figure=px.scatter(iris, x="sepal_length", y="petal_width", color="species")),
    ],
)
page_2 = vm.Page(
    title="My second page",
    components=[
        vm.Card(text="My text here"),
    ],
)
page_3 = vm.Page(
    title="My third page",
    components=[
        vm.Graph(figure=px.scatter(iris, x="sepal_length", y="sepal_width", color="species")),
    ],
)

dashboard = vm.Dashboard(pages=[page_1, page_2, page_3])
Vizro().build(dashboard).run()

Run and edit this code in Py.Cafe

# Still requires a .py to add data to the data manager and parse YAML configuration
# See yaml_version example
pages:
  - components:
      - figure:
          _target_: scatter
          data_frame: iris
          x: sepal_length
          y: petal_width
          color: species
        type: graph
    title: My first page
  - components:
     - text: My text here
       type: card
    title: My second page
  - components:
      - figure:
          _target_: scatter
          data_frame: iris
          x: sepal_length
          y: sepal_width
          color: species
        type: graph
    title: My third page

DefaultNavigation

Include a subset of pages

To include only some of your dashboard pages in your navigation then list them in the pages argument of the Navigation model. To refer to a page inside the Navigation model, you should always use the page's id, which defaults to the page title, we specify pages = ["My first page", "My second page"] rather than pages=[page_1, page_2].

Navigation with only some pages

# page_1, page_2, page_3 defined as in default example
dashboard = vm.Dashboard(
    pages=[page_1, page_2, page_3], navigation=vm.Navigation(pages=["My first page", "My second page"])
)
Vizro().build(dashboard).run()
from vizro import Vizro
import vizro.plotly.express as px
import vizro.models as vm

iris = px.data.iris()

page_1 = vm.Page(
    title="My first page",
    components=[
        vm.Graph(figure=px.scatter(iris, x="sepal_length", y="petal_width", color="species")),
    ],
)
page_2 = vm.Page(
    title="My second page",
    components=[
        vm.Card(text="My text here"),
    ],
)
page_3 = vm.Page(
    title="My third page",
    components=[
        vm.Graph(figure=px.scatter(iris, x="sepal_length", y="sepal_width", color="species")),
    ],
)

dashboard = vm.Dashboard(
    pages=[page_1, page_2, page_3], navigation=vm.Navigation(pages=["My first page", "My second page"])
)

Vizro().build(dashboard).run()

Run and edit this code in Py.Cafe

# Still requires a .py to add data to the data manager and parse YAML configuration
# See yaml_version example
# pages defined as in default example
navigation:
  pages:
    - My first page
    - My second page

OnlySomePages

Group pages

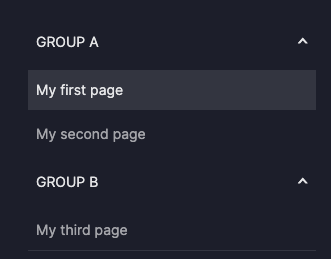
You can also group your pages together by specifying pages as a dictionary:

Grouping pages

# page_1, page_2, page_3 defined as in default example
dashboard = vm.Dashboard(
    pages=[page_1, page_2, page_3],
    navigation=vm.Navigation(pages={"Group A": ["My first page", "My second page"], "Group B": ["My third page"]}),
)
Vizro().build(dashboard).run()
from vizro import Vizro
import vizro.plotly.express as px
import vizro.models as vm

iris = px.data.iris()

page_1 = vm.Page(
    title="My first page",
    components=[
        vm.Graph(figure=px.scatter(iris, x="sepal_length", y="petal_width", color="species")),
    ],
)
page_2 = vm.Page(
    title="My second page",
    components=[
        vm.Card(text="My text here"),
    ],
)
page_3 = vm.Page(
    title="My third page",
    components=[
        vm.Graph(figure=px.scatter(iris, x="sepal_length", y="sepal_width", color="species")),
    ],
)

dashboard = vm.Dashboard(
    pages=[page_1, page_2, page_3],
    navigation=vm.Navigation(pages={"Group A": ["My first page", "My second page"], "Group B": ["My third page"]}),
)
Vizro().build(dashboard).run()

Run and edit this code in Py.Cafe

# Still requires a .py to add data to the data manager and parse YAML configuration
# See yaml_version example
# pages defined as in default example
navigation:
  pages:
    Group A:
      - My first page
      - My second page
    Group B:
      - My third page

GroupedNavigation

Use a navigation bar with icons

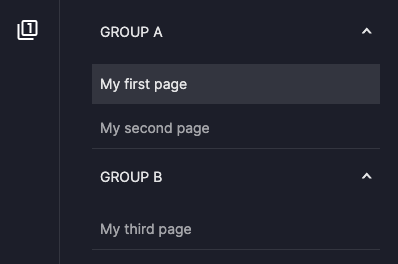
Another way to group together pages in the navigation is to use a NavBar with icons. The simplest way to use this is to change the nav_selector specified in Navigation:

Using NavBar

 # page_1, page_2, page_3 defined as in default example
dashboard = vm.Dashboard(
    pages=[page_1, page_2, page_3],
    navigation=vm.Navigation(
        pages={"Group A": ["My first page", "My second page"], "Group B": ["My third page"]}, nav_selector=vm.NavBar()
    ),
)
Vizro().build(dashboard).run()
from vizro import Vizro
import vizro.plotly.express as px
import vizro.models as vm

iris = px.data.iris()

page_1 = vm.Page(
    title="My first page",
    components=[
        vm.Graph(figure=px.scatter(iris, x="sepal_length", y="petal_width", color="species")),
    ],
)
page_2 = vm.Page(
    title="My second page",
    components=[
        vm.Card(text="My text here"),
    ],
)
page_3 = vm.Page(
    title="My third page",
    components=[
        vm.Graph(figure=px.scatter(iris, x="sepal_length", y="sepal_width", color="species")),
    ],
)

dashboard = vm.Dashboard(
    pages=[page_1, page_2, page_3],
    navigation=vm.Navigation(
        pages={"Group A": ["My first page", "My second page"], "Group B": ["My third page"]}, nav_selector=vm.NavBar()
    ),
)

Vizro().build(dashboard).run()

Run and edit this code in Py.Cafe

# Still requires a .py to add data to the data manager and parse YAML configuration
# See yaml_version example
# pages defined as in default example
navigation:
  pages:
    Group A:
      - My first page
      - My second page
    Group B:
      - My third page
  nav_selector:
    type: nav_bar

NavBar

Here, the first level of the navigation hierarchy ("Group A" and "Group B") is represented by an icon in a navigation bar, and the second level of the navigation (the pages) is represented by an accordion. By default, the set of icons used are the filter icons from the Google Material icons library. The icon label ("Group A" and "Group B") appears as a tooltip on hovering over the icon.

Customize the navigation bar

Under the hood, NavBar uses NavLink to build the icons in the navigation bar. It is possible to customize the navigation further by providing the NavLink models yourself.

The same configuration for grouping pages applies inside a NavLink:

Accordions inside a Navlink

 # page_1, page_2, page_3 defined as in default example
dashboard = vm.Dashboard(
    pages=[page_1, page_2, page_3],
    navigation=vm.Navigation(
        nav_selector=vm.NavBar(
            items=[
                vm.NavLink(
                    label="Section 1",
                    pages={"Group A": ["My first page", "My second page"], "Group B": ["My third page"]},
                )
            ]
        )
    ),
)
Vizro().build(dashboard).run()
from vizro import Vizro
import vizro.plotly.express as px
import vizro.models as vm

iris = px.data.iris()

page_1 = vm.Page(
    title="My first page",
    components=[
        vm.Graph(figure=px.scatter(iris, x="sepal_length", y="petal_width", color="species")),
    ],
)
page_2 = vm.Page(
    title="My second page",
    components=[
        vm.Card(text="My text here"),
    ],
)
page_3 = vm.Page(
    title="My third page",
    components=[
        vm.Graph(figure=px.scatter(iris, x="sepal_length", y="sepal_width", color="species")),
    ],
)

dashboard = vm.Dashboard(
    pages=[page_1, page_2, page_3],
    navigation=vm.Navigation(
        nav_selector=vm.NavBar(
            items=[
                vm.NavLink(
                    label="Section 1",
                    pages={"Group A": ["My first page", "My second page"], "Group B": ["My third page"]},
                )
            ]
        )
    ),
)

Vizro().build(dashboard).run()

Run and edit this code in Py.Cafe

# Still requires a .py to add data to the data manager and parse YAML configuration
# See yaml_version example
# pages defined as in default example
navigation:
  nav_selector:
    type: nav_bar
    items:
      - label: Section 1
        pages:
          Group A:
            - My first page
            - My second page
          Group B:
            - My third page

AccordionInsideNavBar

You can alter the icons used by specifying the name of the icon in the Google Material icons library:

Custom icon

 # page_1, page_2, page_3 defined as in default example
dashboard = vm.Dashboard(
    pages=[page_1, page_2, page_3],
    navigation=vm.Navigation(
        nav_selector=vm.NavBar(
            items=[
                vm.NavLink(
                    label="Section 1",
                    icon="Bar Chart",
                    pages=["My first page", "My second page"],
                ),
                vm.NavLink(label="Section 2", icon="Pie Chart", pages=["My third page"]),
            ]
        )
    ),
)
from vizro import Vizro
import vizro.plotly.express as px
import vizro.models as vm

iris = px.data.iris()

page_1 = vm.Page(
    title="My first page",
    components=[
        vm.Graph(figure=px.scatter(iris, x="sepal_length", y="petal_width", color="species")),
    ],
)
page_2 = vm.Page(
    title="My second page",
    components=[
        vm.Card(text="My text here"),
    ],
)
page_3 = vm.Page(
    title="My third page",
    components=[
        vm.Graph(figure=px.scatter(iris, x="sepal_length", y="sepal_width", color="species")),
    ],
)

dashboard = vm.Dashboard(
    pages=[page_1, page_2, page_3],
    navigation=vm.Navigation(
        nav_selector=vm.NavBar(
            items=[
                vm.NavLink(
                    label="Section 1",
                    icon="Bar Chart",
                    pages=["My first page", "My second page"],
                ),
                vm.NavLink(label="Section 2", icon="Pie Chart", pages=["My third page"]),
            ]
        )
    ),
)

Vizro().build(dashboard).run()

Run and edit this code in Py.Cafe

# Still requires a .py to add data to the data manager and parse YAML configuration
# See yaml_version example
# pages defined as in default example
navigation:
  nav_selector:
    type: nav_bar
    items:
      - label: Section 1
        icon: Bar Chart
        pages:
          - My first page
          - My second page
      - label: Section 1
        icon: Pie Chart
        pages:
          - My third page

CustomIcons