How to create a dashboard
This guide shows you how to configure and call a Dashboard model using either pydantic models, Python dictionaries, YAML, or JSON.
To create a dashboard:
- Choose one of the possible configuration syntaxes
- Create your
pages - (optional) Customize your
navigation, see our guide on Navigation - (optional) Set a
titlefor your dashboard - (optional) Set a
descriptionfor your dashboard to add a tooltip and set meta tags - (optional) Choose a
theme, see our guide on Themes - Add your
dashboardto thebuildcall of Vizro
Use dashboard configuration options
Dashboard Configuration Syntaxes
import vizro.plotly.express as px
from vizro import Vizro
import vizro.models as vm
df = px.data.iris()
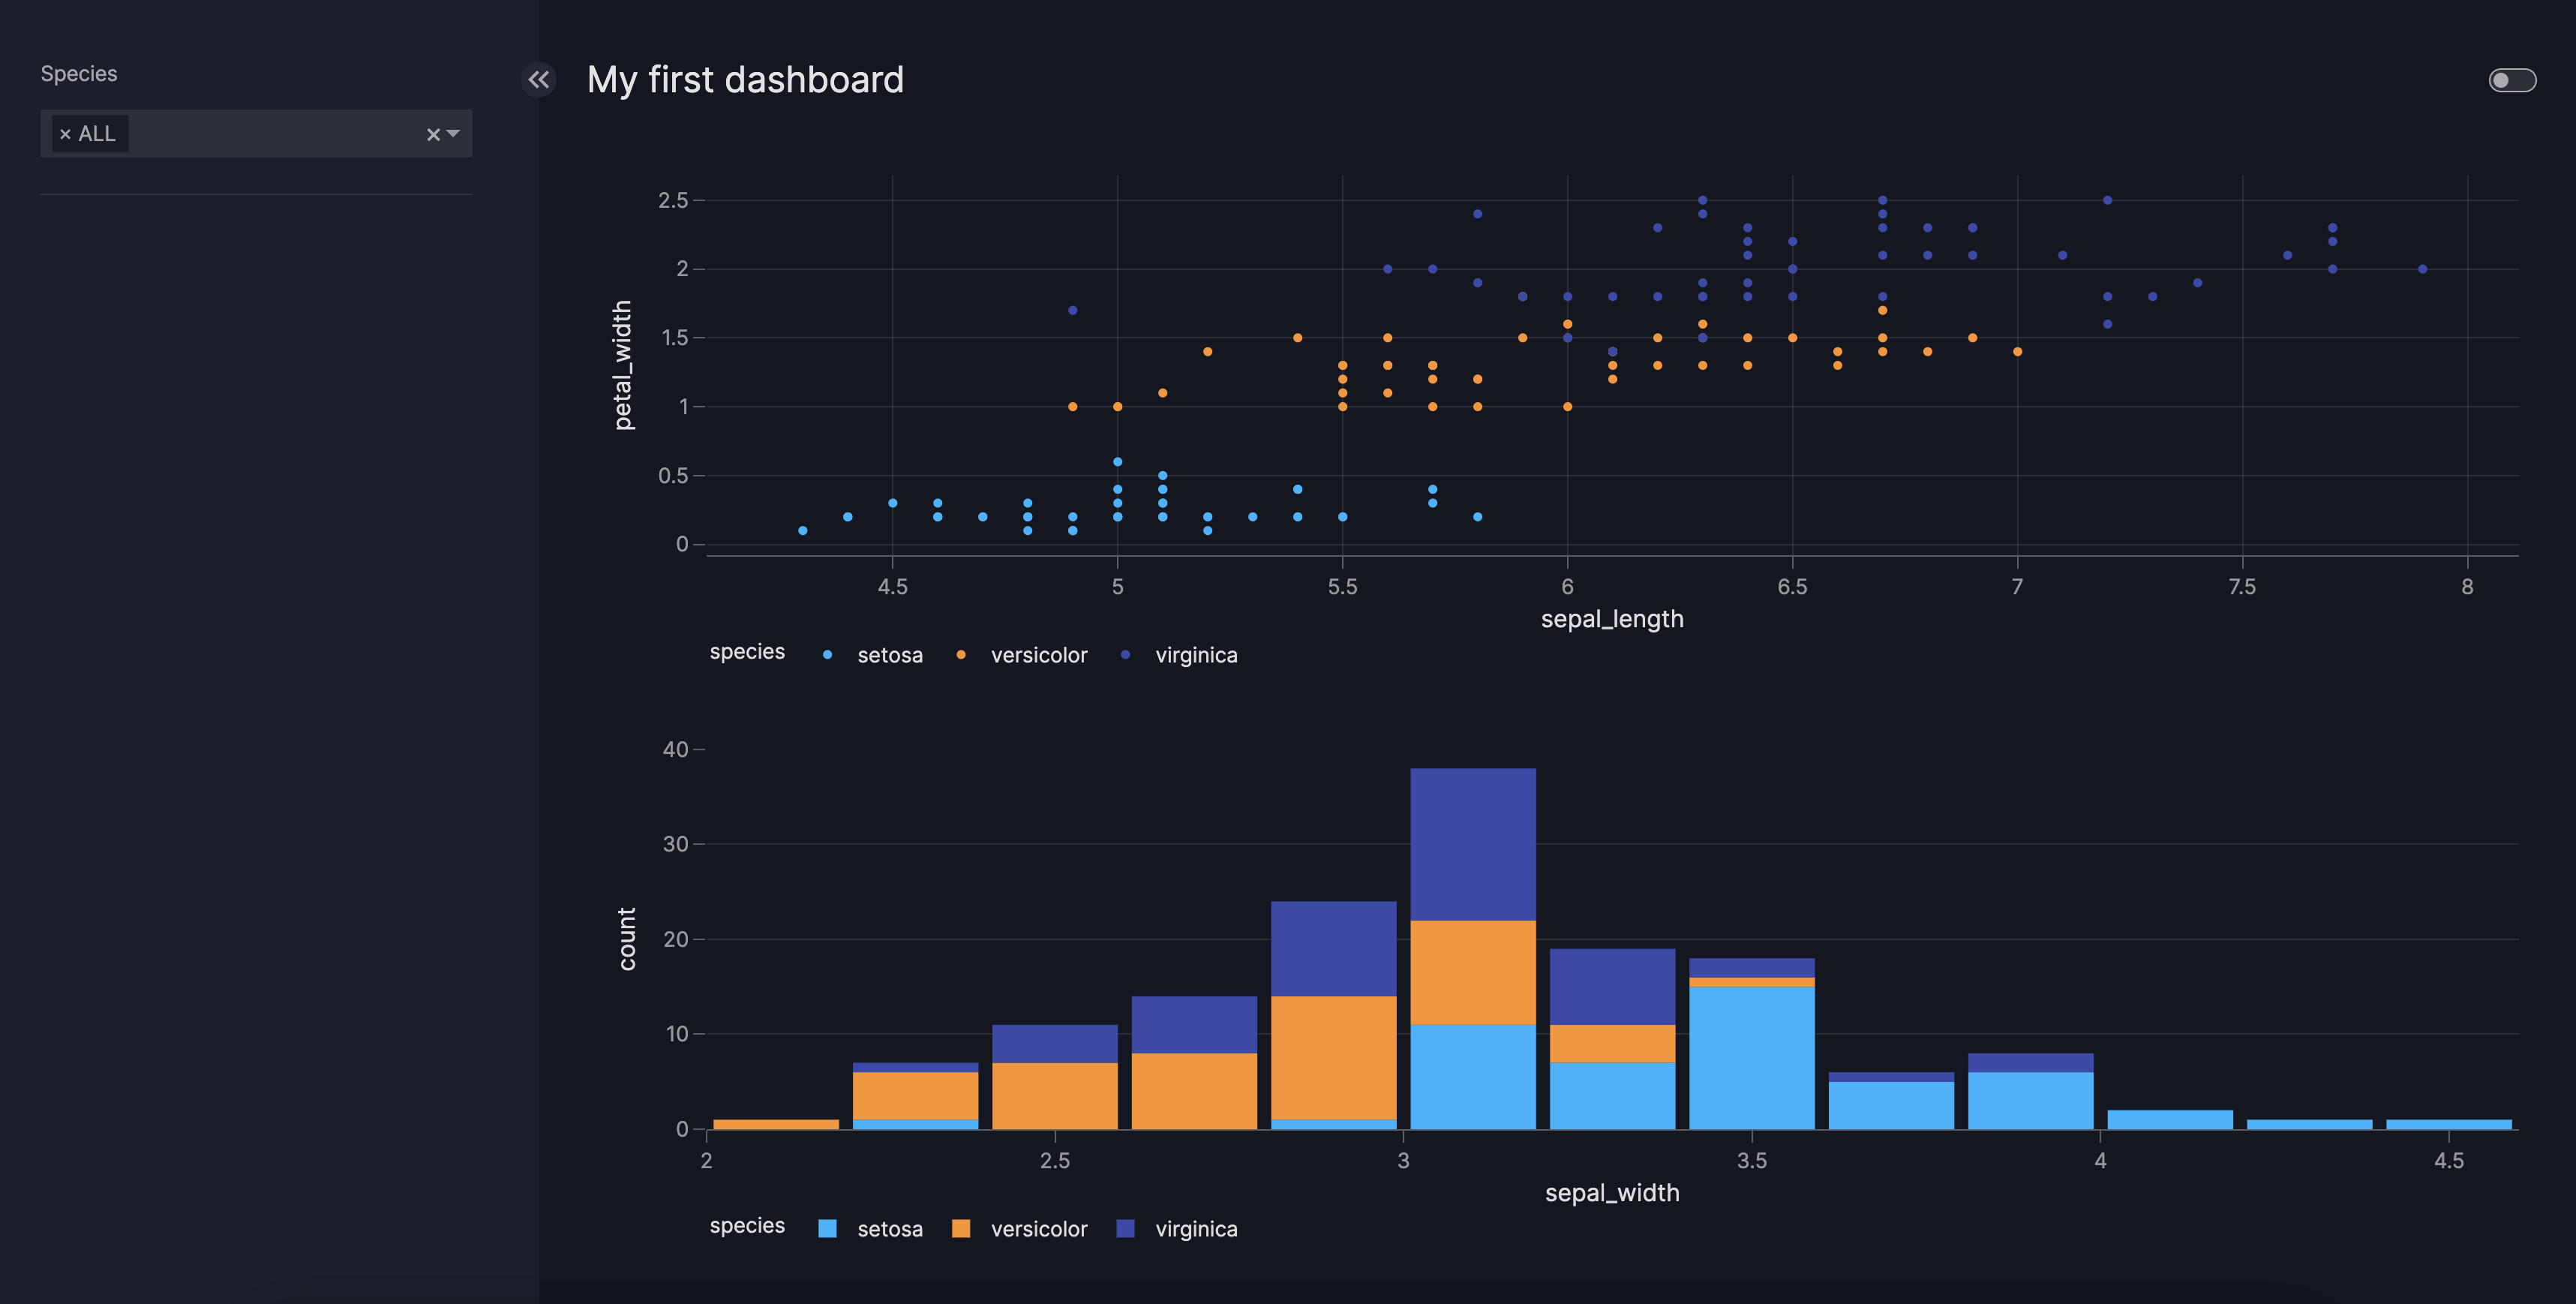
page = vm.Page(
title="My first dashboard",
components=[
vm.Graph(figure=px.scatter(df, x="sepal_length", y="petal_width", color="species")),
vm.Graph(figure=px.histogram(df, x="sepal_width", color="species"))],
controls=[
vm.Filter(column="species"),
],
)
dashboard = vm.Dashboard(pages=[page])
Vizro().build(dashboard).run()
![]() Run and edit this code in Py.Cafe
Run and edit this code in Py.Cafe
import vizro.plotly.express as px
from vizro import Vizro

df = px.data.iris()

page = {
    "title": "My first dashboard",
    "components": [
        {
            "type": "graph",
            "figure": px.scatter(
                df,
                x="sepal_length",
                y="petal_width",
                color="species",
            ),
        },
        {
            "type": "graph",
            "figure": px.histogram(
                df,
                x="sepal_width",
                color="species"
            ),
        },
    ],
    "controls": [
        {
            "type": "filter",
            "column": "species",
        },
    ],
}

dashboard = {"pages": [page]}
Vizro().build(dashboard).run()
# Still requires a .py to add data to the data manager and parse YAML configuration
# See yaml_version example
pages:
  - components:
      - figure:
          _target_: scatter
          data_frame: iris
          x: sepal_length
          y: petal_width
          color: species
        type: graph
      - figure:
          _target_: histogram
          data_frame: iris
          x: sepal_width
          color: species
        type: graph
    controls:
      - column: species
        type: filter
    title: My first dashboard
{
  "pages": [
    {
      "components": [
        {
          "figure": {
            "_target_": "scatter",
            "color": "species",
            "data_frame": "iris",
            "x": "sepal_length",
            "y": "petal_width"
          },
          "type": "graph"
        },
        {
          "figure": {
            "_target_": "histogram",
            "color": "species",
            "data_frame": "iris",
            "x": "sepal_width"
          },
          "type": "graph"
        }
      ],
      "controls": [
        {
          "column": "species",
          "type": "filter"
        }
      ],
      "title": "My first dashboard"
    }
  ]
}
Extra .py files for yaml and json required
Note that in the yaml and json example an extra .py is required to register the data and parse the yaml/json configuration.
from pathlib import Path

import yaml

import vizro.plotly.express as px
from vizro import Vizro
from vizro.managers import data_manager
from vizro.models import Dashboard

data_manager["iris"] = px.data.iris()
dashboard = yaml.safe_load(Path("dashboard.yaml").read_text(encoding="utf-8"))
dashboard = Dashboard(**dashboard)

Vizro().build(dashboard).run()
import json
from pathlib import Path

import vizro.plotly.express as px
from vizro import Vizro
from vizro.managers import data_manager
from vizro.models import Dashboard

data_manager["iris"] = px.data.iris()
dashboard = json.loads(Path("dashboard.json").read_text(encoding="utf-8"))
dashboard = Dashboard(**dashboard)

Vizro().build(dashboard).run()
After running the dashboard, you can access the dashboard via localhost:8050.
Add a dashboard title
If supplied, the title of the Dashboard model displays a heading at the top of every page.
Add a dashboard logo
Vizro automatically displays a logo in the top-left corner of each page if you place an image named logo.<extension> in the assets folder. You can also add theme-specific logos named logo-dark.<extension> and logo-light.<extension>, which switch automatically with the active theme. By default, clicking the logo takes you to the homepage.
![]()
Add a dashboard tooltip
The description argument enables you to add helpful context to your dashboard by displaying an info icon next to its title. Hovering over the icon shows a tooltip with your provided text.
You can provide Markdown text as a string to use the default info icon or a Tooltip model to use any icon from the Google Material Icons library.
![]()
Customize the header
You can add custom content to the dashboard header using the Dashboard.custom_header method. This enables you to inject any Dash component(s) into a dedicated area of the header. Common examples include text, badges, or buttons.

To add items to the custom header area, subclass the Dashboard model and override the custom_header method to return your desired Dash component(s):
- The returned value can be a single Dash component or a list of components.
- The custom header area is styled as a flex row with an 8px gap.
- The custom content will appear in the header, to the left of the theme switch.
Customize dashboard header
from vizro import Vizro
import vizro.models as vm
from typing import Literal
from dash import html
import dash_bootstrap_components as dbc


class CustomDashboard(vm.Dashboard):
    type: Literal["custom_dashboard"] = "custom_dashboard"

    def custom_header(self):
        return [html.Div("Good morning, Li! ☕"), dbc.Badge("Tuesday", color="primary")]


page = vm.Page(title="Page Title", components=[vm.Card(text="Placeholder")])
dashboard = CustomDashboard(pages=[page], title="Dashboard with custom header")
Vizro().build(dashboard).run()
![]() Run and edit this code in Py.Cafe
Run and edit this code in Py.Cafe
Custom dashboards are currently only possible via Python configuration.

Meta tags for social media
Vizro automatically adds meta tags to display a preview card when your app is shared on social media and chat clients. To see an example, try sharing an example such the Vizro visual vocabulary dashboard.
The preview includes:
- the dashboard
titleand the Pagetitle - an image if a suitable assets file exists
- the dashboard
descriptionor the Pagedescription
Browser title
The website icon, Dashboard title (if supplied) and Page title are displayed in the browser's title bar. For example, if your Dashboard title is "Vizro Demo" and the Page title is "Homepage", then the title in the browser tab will be "Vizro Demo: Homepage".