How to create custom Dash AG Grids and Dash DataTables
In cases where the available arguments for the dash_ag_grid or dash_data_table models are not sufficient, you can create a custom Dash AG Grid or Dash DataTable.
The Table and the AgGrid model accept the figure argument, where you can enter any dash_ag_grid or dash_data_table chart as explained in the user guide on tables.
More examples of AG Grid
If you would like to see more than the below examples on what can be done with AG Grid and Dash DataTables, head to the Dash AG Grid and Dash DataTable documentation respectively. Almost anything you see there is possible in Vizro by modifying the examples below.
One reason to customize could be that you want to create a table/grid that requires computations that can be controlled by parameters. The below example shows this for the case of AG Grid and Dash DataTable.
Steps to create a custom table
- Define a function that returns a
dash_ag_grid.AgGridordash_table.DataTableobject. - Decorate it with
@capture("ag_grid")or@capture("table"). - The function must accept a
data_frameargument (of typepandas.DataFrame). - The table should be derived from and require only one
pandas.DataFrame. Dataframes from other arguments will not react to dashboard controls such asFilter. - Pass your function to the
figureargument of theTableorAgGridmodel.
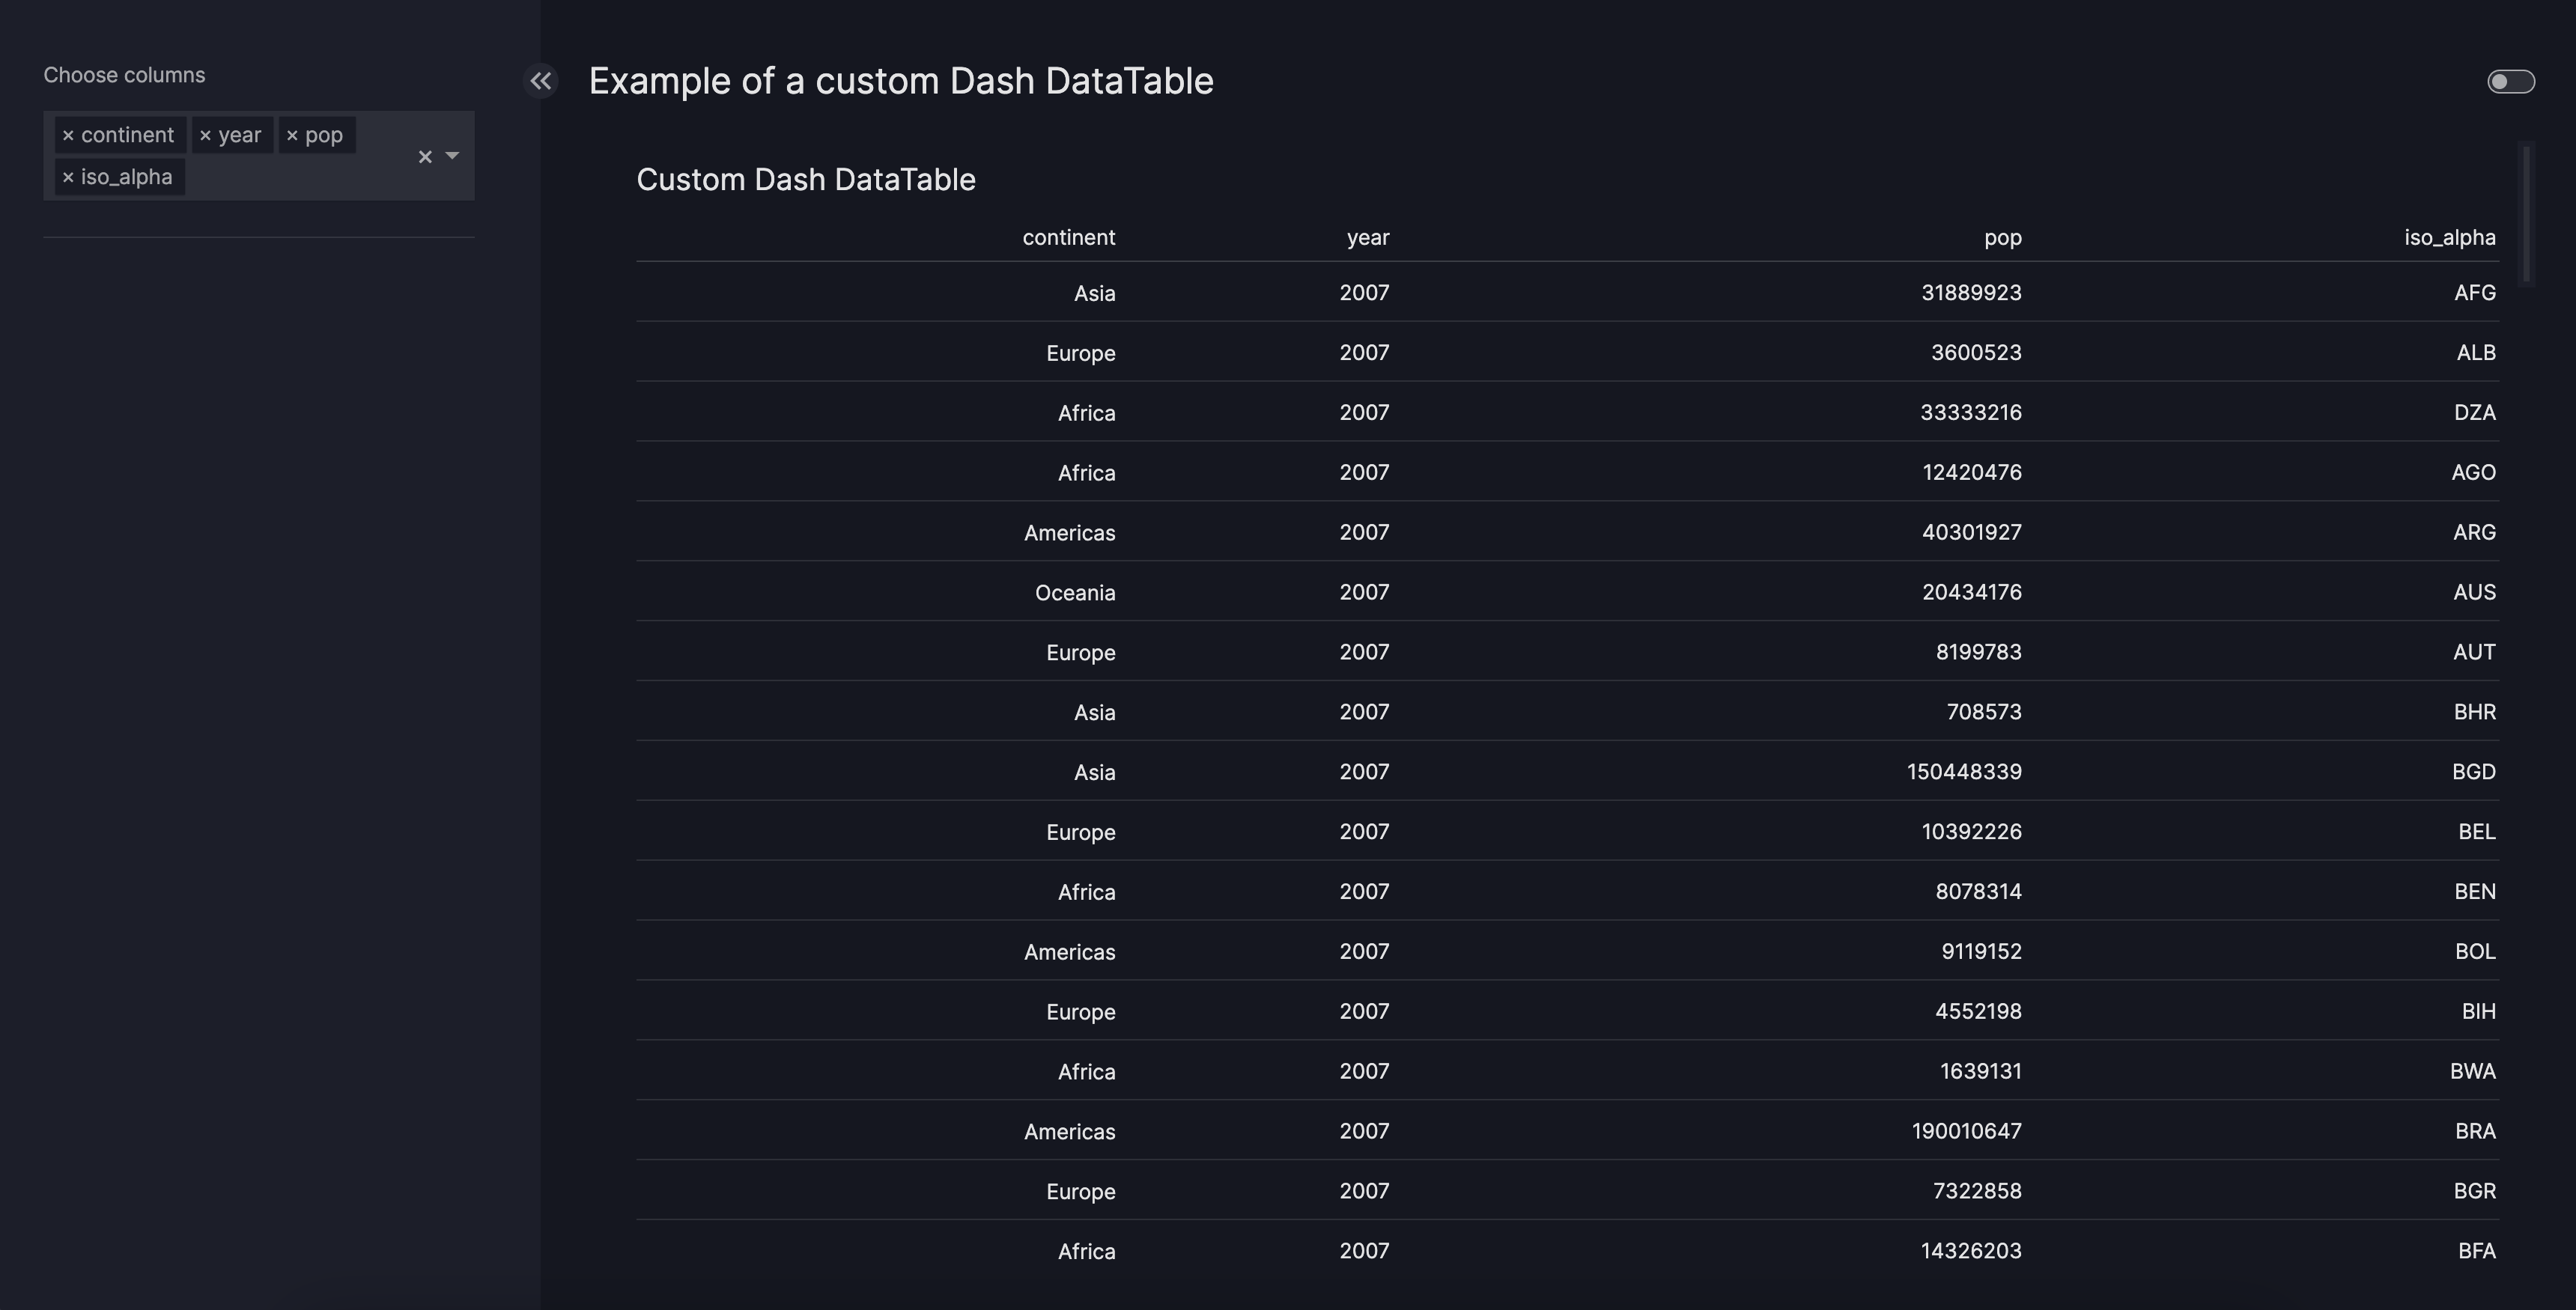
The following examples show a possible version of a custom table. In this case the argument chosen_columns was added, which you can control with a parameter:
Custom Dash DataTable
from dash import dash_table

import vizro.models as vm
import vizro.plotly.express as px
from vizro import Vizro
from vizro.models.types import capture

df = px.data.gapminder().query("year == 2007")


@capture("table")
def my_custom_table(chosen_columns: list[str], data_frame=None):
    columns = [{"name": i, "id": i} for i in chosen_columns]
    defaults = {
        "style_as_list_view": True,
        "style_data": {"border_bottom": "1px solid var(--bs-border-color)", "height": "40px"},
        "style_header": {
            "border_bottom": "1px solid var(--bs-border-color-translucent)",
            "border_top": "None",
            "height": "32px",
        },
    }
    return dash_table.DataTable(data=data_frame.to_dict("records"), columns=columns, **defaults)


page = vm.Page(
    title="Example of a custom Dash DataTable",
    components=[
        vm.Table(
            id="custom_table",
            title="Custom Dash DataTable",
            figure=my_custom_table(
                data_frame=df, chosen_columns=["country", "continent", "lifeExp", "pop", "gdpPercap"]
            ),
        ),
    ],
    controls=[
        vm.Parameter(
            targets=["custom_table.chosen_columns"],
            selector=vm.Dropdown(title="Choose columns", options=df.columns.to_list()),
        )
    ],
)

dashboard = vm.Dashboard(pages=[page])
Vizro().build(dashboard).run()
![]() Run and edit this code in Py.Cafe
Run and edit this code in Py.Cafe
# Still requires a .py to add data to the data manager, define CapturedCallables, and parse YAML configuration
# More explanation in the docs on `Dashboard` and extensions.
pages:
  - components:
      - figure:
          _target_: __main__.my_custom_table
          chosen_columns:
            - country
            - continent
            - lifeExp
            - pop
            - gdpPercap
          data_frame: gapminder_2007
        id: custom_table
        title: Custom Dash DataTable
        type: table
    controls:
      - selector:
          options:
            - country
            - continent
            - lifeExp
            - pop
            - gdpPercap
            - year
          title: Choose columns
          type: dropdown
        targets:
          - custom_table.chosen_columns
        type: parameter
    title: Example of a custom Dash DataTable
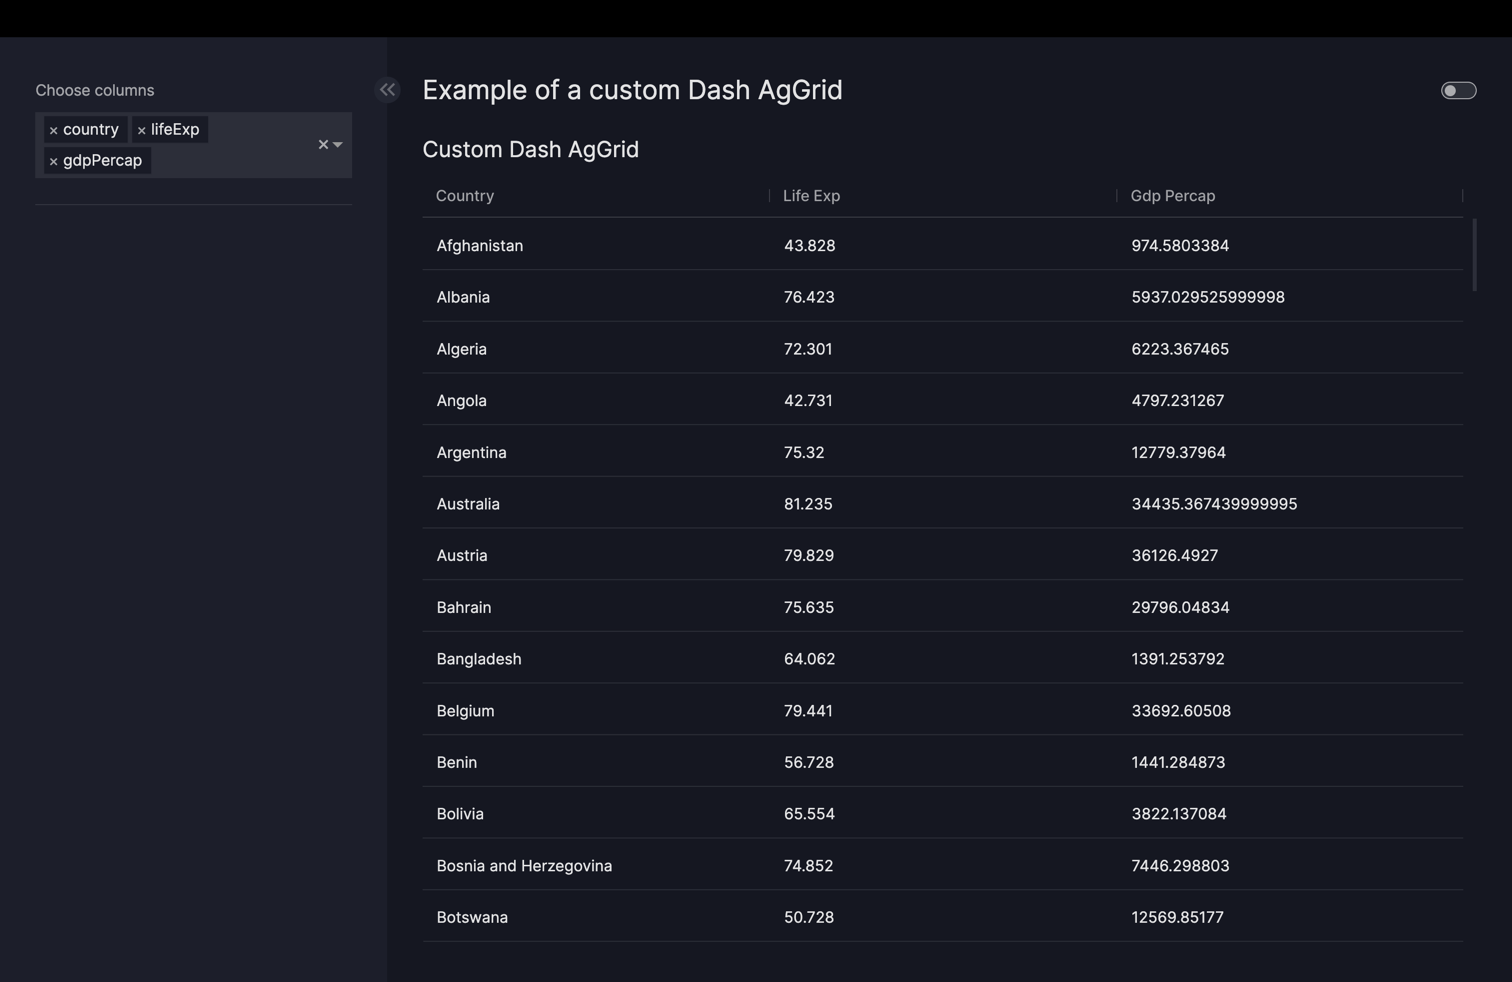
Custom Dash AgGrid
import vizro.models as vm
import vizro.plotly.express as px
from dash_ag_grid import AgGrid
from vizro import Vizro
from vizro.models.types import capture

df = px.data.gapminder().query("year == 2007")


@capture("ag_grid")
def my_custom_aggrid(chosen_columns: list[str], data_frame=None):
    defaults = {
        "className": "ag-theme-vizro",
        "defaultColDef": {
            "resizable": True,
            "sortable": True,
            "filter": True,
            "filterParams": {
                "buttons": ["apply", "reset"],
                "closeOnApply": True,
            },
            "flex": 1,
            "minWidth": 70,
        },
        "dashGridOptions": {
            "theme": {"function": "vizroTheme(themeQuartz, agGrid)"},
        },
    }
    return AgGrid(
        columnDefs=[{"field": col} for col in chosen_columns], rowData=data_frame.to_dict("records"), **defaults
    )


page = vm.Page(
    title="Example of a custom Dash AgGrid",
    components=[
        vm.AgGrid(
            id="custom_ag_grid",
            title="Custom Dash AgGrid",
            figure=my_custom_aggrid(
                data_frame=df, chosen_columns=["country", "continent", "lifeExp", "pop", "gdpPercap"]
            ),
        ),
    ],
    controls=[
        vm.Parameter(
            targets=["custom_ag_grid.chosen_columns"],
            selector=vm.Dropdown(title="Choose columns", options=df.columns.to_list()),
        )
    ],
)

dashboard = vm.Dashboard(pages=[page])
Vizro().build(dashboard).run()
![]() Run and edit this code in Py.Cafe
Run and edit this code in Py.Cafe
# Still requires a .py to add data to the data manager, define CapturedCallables and parse YAML configuration
# More explanation in the docs on `Dashboard` and extensions.
pages:
  - components:
      - figure:
          _target_: __main__.my_custom_aggrid
          chosen_columns:
            - country
            - continent
            - lifeExp
            - pop
            - gdpPercap
          data_frame: gapminder_2007
        id: custom_ag_grid
        title: Custom Dash AgGrid
        type: ag_grid
    controls:
      - selector:
          options:
            - country
            - continent
            - lifeExp
            - pop
            - gdpPercap
            - year
          title: Choose columns
          type: dropdown
        targets:
          - custom_ag_grid.chosen_columns
        type: parameter
    title: Example of a custom Dash AgGrid
Interact with other graphs and tables
A custom AG Grid can act as a source for interactions with other components, for example to cross-filter another graph or table when the user clicks on a point.