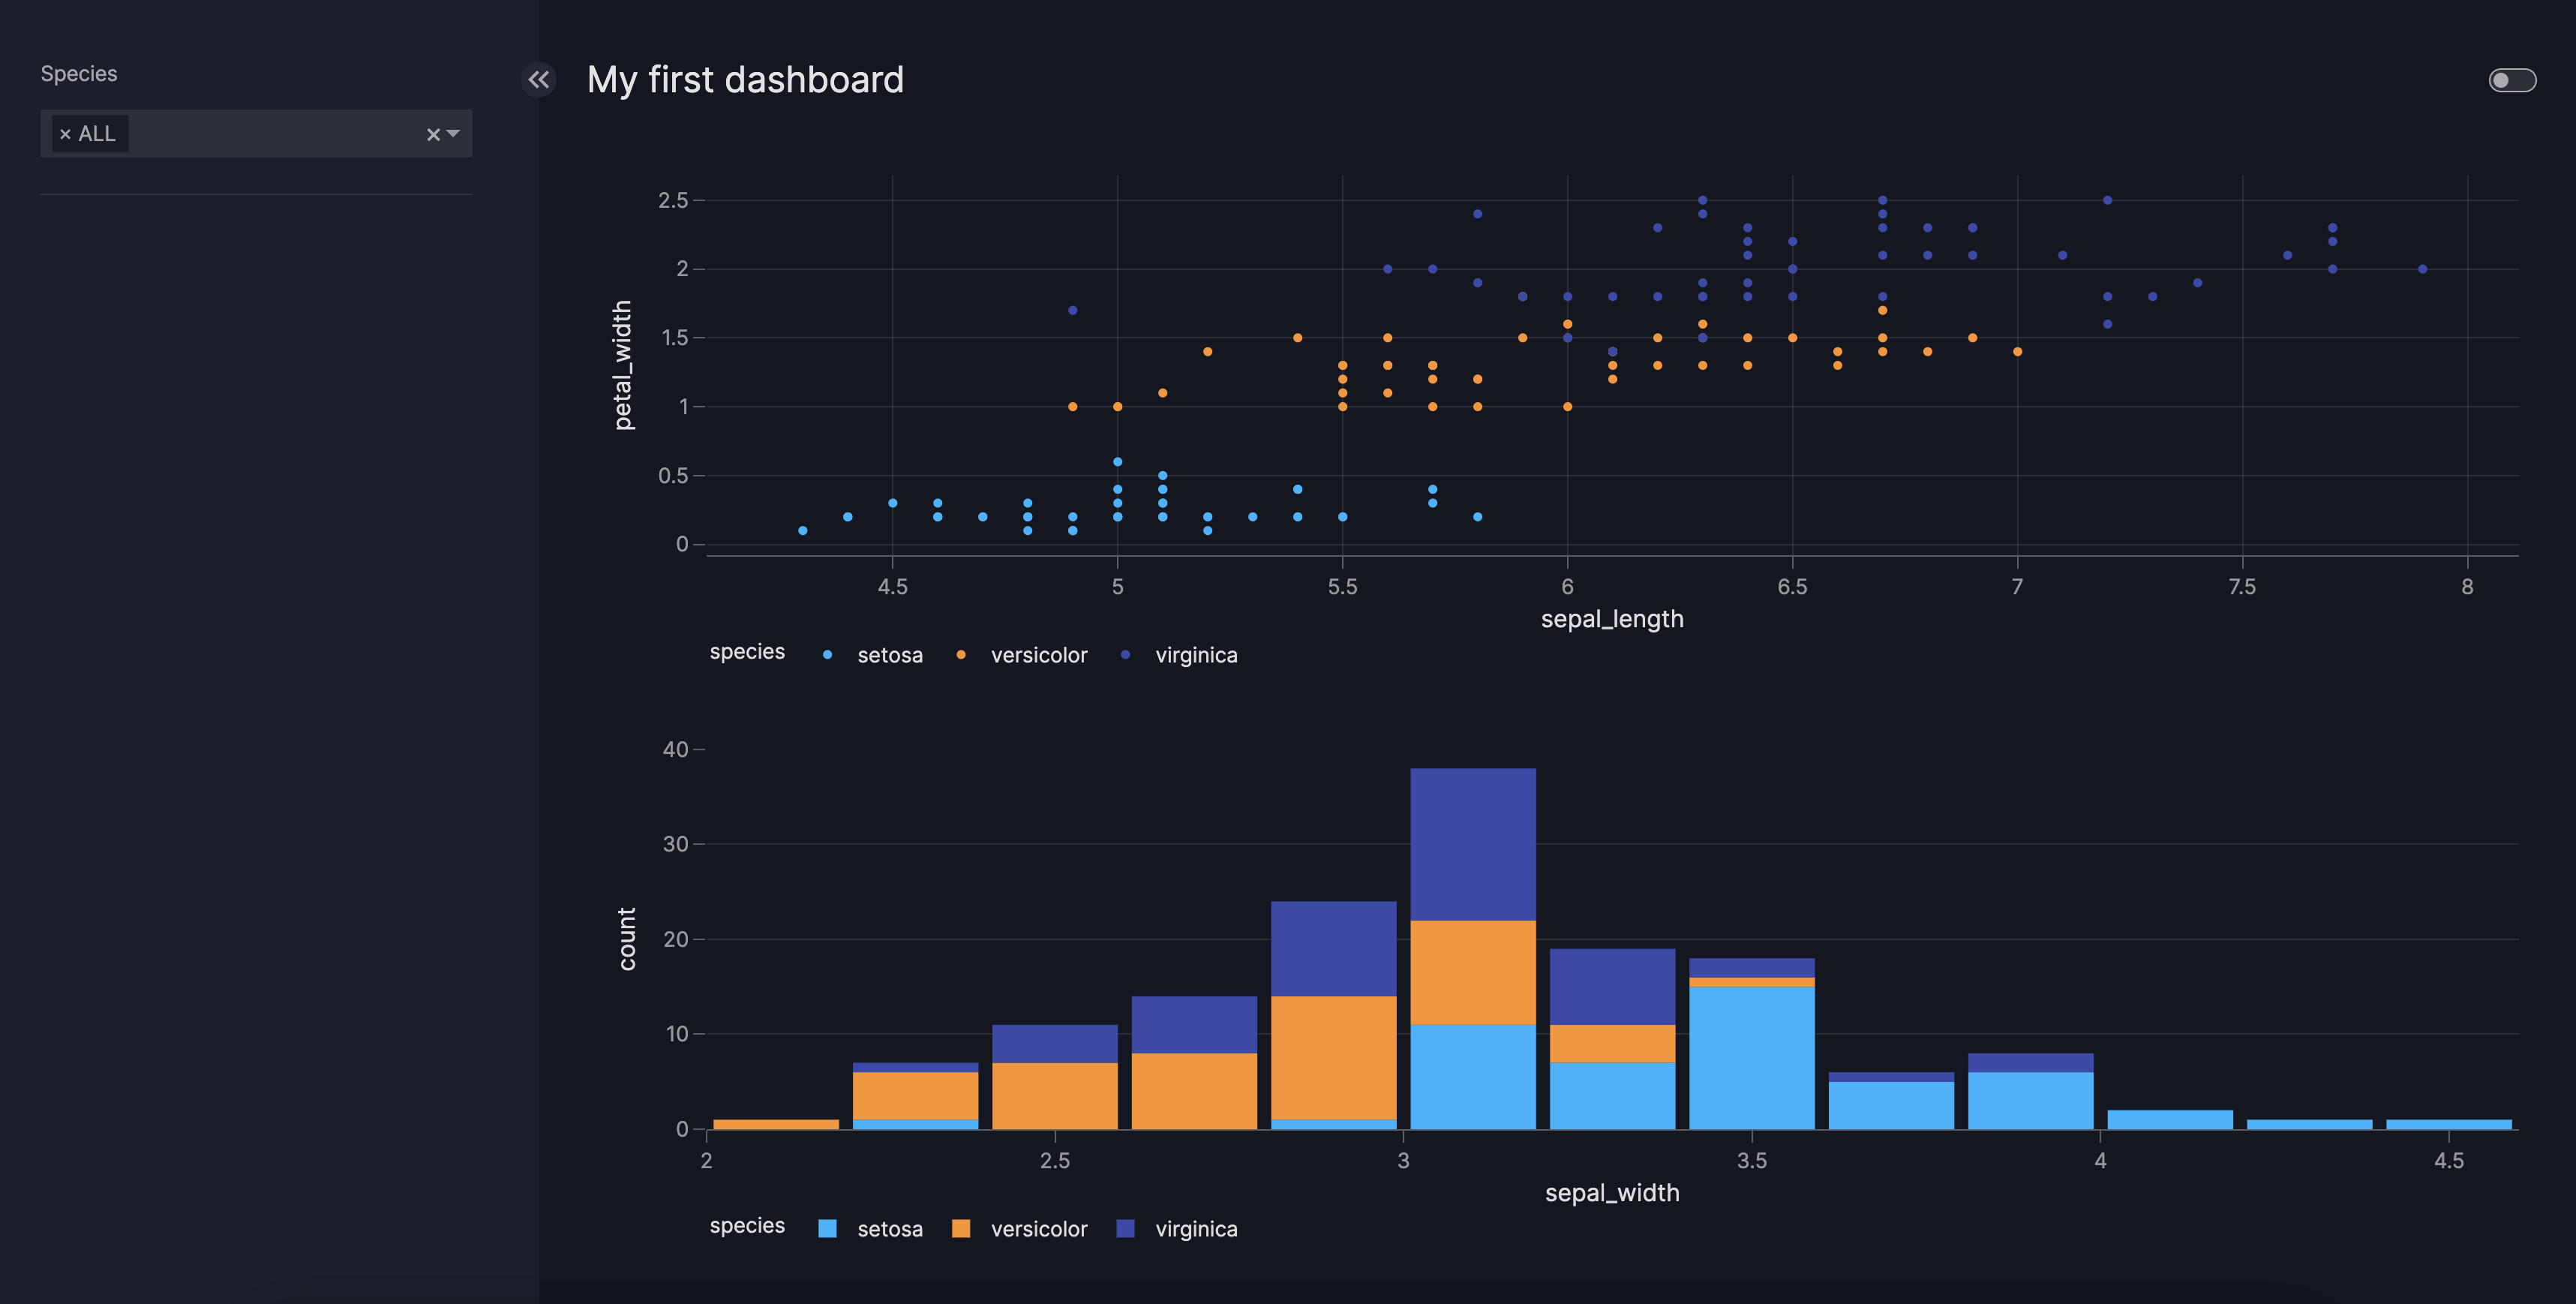
A first dashboard
This is a short tutorial for you to create your first dashboard, showing you the basic setup so you can explore Vizro further.
Once you've completed this tutorial, the following "Explore Vizro" tutorial creates a more complex dashboard so you can explore Vizro's features.
Get started
1. Install Vizro and its dependencies
If you haven't already installed Vizro, follow the installation guide.
2. Open a Jupyter Notebook
A good way to initially explore Vizro is from inside a Jupyter Notebook.
Install and run Jupyter
If you haven't used Jupyter before, you may need to install the Jupyter package. From the terminal window:
Alternatively, you can work within Anaconda Navigator as described in the Vizro installation guide.
Activate the virtual environment you used to install Vizro, and start a new Notebook as follows:
The command opens Jupyter in a browser tab. Navigate to a preferred folder in which to create this new dashboard.
Create a new Python 3 (ipykernel) Notebook from the "New" dropdown. Confirm your Vizro installation by typing the following into a cell in the Notebook and running it.
You should see a return output of the form x.y.z.
What could go wrong?
If you are following this tutorial in a Jupyter Notebook, you need to restart the kernel each time you evaluate the code. If you do not, you will see error messages such as "Components must uniquely map..." because those components already exist from the previous evaluation.
3. Create your first dashboard
Paste the following example into a Notebook cell, run it, and view the generated dashboard by typing localhost:8050 into your browser.
Dashboard Configuration Syntaxes
import vizro.plotly.express as px
from vizro import Vizro
import vizro.models as vm

df = px.data.iris()

page = vm.Page(
    title="My first dashboard",
    components=[
        vm.Graph(id="scatter_chart", figure=px.scatter(df, x="sepal_length", y="petal_width", color="species")),
        vm.Graph(id="hist_chart", figure=px.histogram(df, x="sepal_width", color="species")),
    ],
    controls=[
        vm.Filter(column="species", selector=vm.Dropdown(value=["ALL"])),
    ],
)

dashboard = vm.Dashboard(pages=[page])

Vizro().build(dashboard).run()
4. Explore further
You are now ready to explore Vizro further, by working through the "Explore Vizro" tutorial or by consulting the how-to guides.
